Chicago Police Department versus other Illinois Law Enforcement Agencies

Correlation with the Veil of Darkness

By: Tiasia Saunders

Description of the traffic
An illustrative image of a police officer monitoring traffic activity. Photo courtesy of Adobe Stock.

Overview

Using 2024 Chicago Police Department and other Illinois Law Enforcement traffic data, this project examines whether racial disparities extend beyond CPD into suburban and downstate agencies. While CPD has faced scrutiny, especially after the fatal shooting of Dexter Reed, smaller agencies operate with far less oversight and accountability reporting. This analysis uses a veil of darkness lens to explore potential racial disparities.
Veil of Darkness Explanation

  • It is a statistical methodology created by Jeffrey Grogger and Greg Ridgeway (2006) to test for racial bias in traffic stops.
  • It compares daytime vs nighttime stops, based on the idea that darkness masks driver race.
  • If bias exists, minority drivers should be stopped more during daylight hours when race is visible.
  • Time definitions:
    • Daytime: 6 a.m. – 5 p.m.
    • Nighttime: 10 p.m. – 4 a.m.
    • Transition hours excluded: 4–6 a.m. and 5–10 p.m.

Hypothesis / Potential Problems

  • I suspect racial disparities in stop patterns exist across Illinois agencies, not just CPD.
  • Stops and searches may differ by race depending on visibility conditions.
  • The veil of darkness method may be imperfect because it uses fixed time ranges instead of actual sunrise/sunset data.

Data Origin / Table Definitions

  • Data comes from the Investigative Project on Race and Equity (2021–2024 traffic and pedestrian stops data received through a FOIA request).
  • Includes Chicago Police Department and other Illinois law enforcement agencies.
  • Population data from the 2020 U.S. Census is used for per-capita calculations.
  • Sources:

The Why

If disparities exist across all Illinois agencies, it suggests biased enforcement is not isolated to Chicago and may require statewide accountability reforms.

Traffic Stop Timelines

Chicago Police Department Timeline

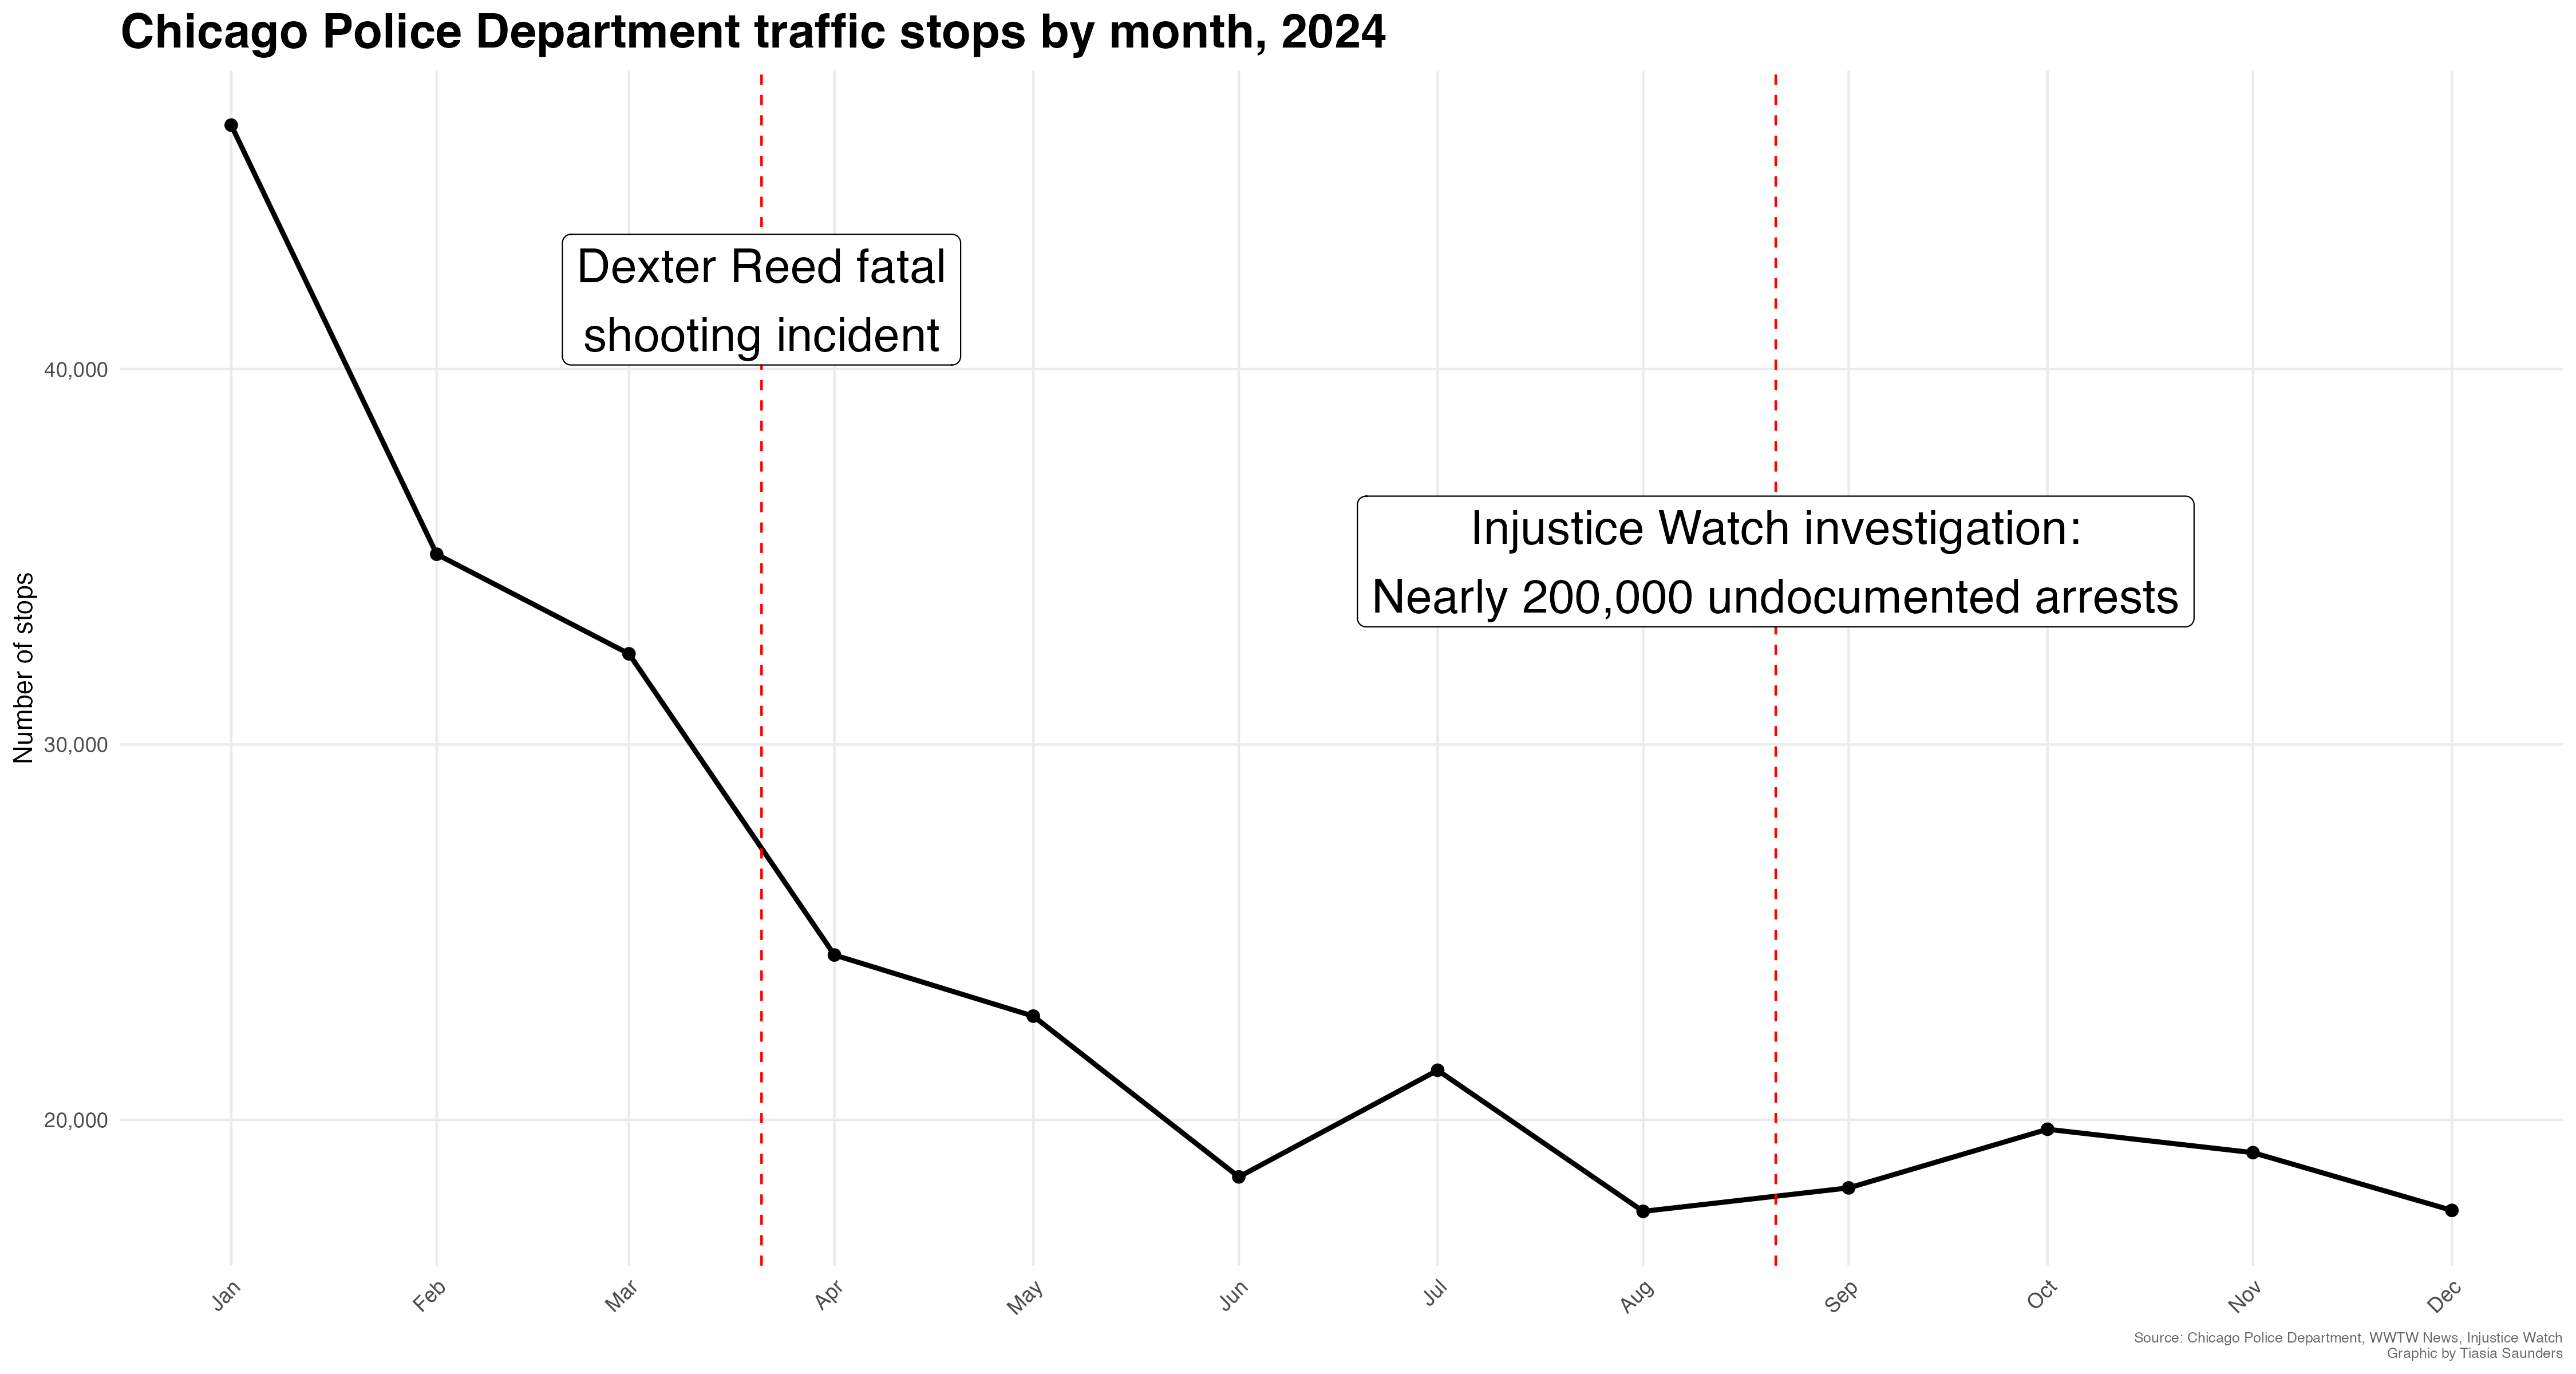
  • Tracks CPD traffic stops by month (2024)
  • So, I looked into an explanation as to why there was a steady decrease of traffic stops by the CPD in 2024, so once looking it up I found this article, which explained that there were 210,622 undocumented traffic stops in 2024, despite a 2003 law requiring them to document every traffic stop.
  • In addition, the Dexter Reed incident in which a 26-year old Black man died at the result of a shootout incident between him and policemen in late March of 2024, may have resulted in heavier scrutiny due to advocacy groups and civil rights lawsuits.
  • The incident had stemmed from a seatbelt violation traffic stop.

Other Illinois Agencies Timeline

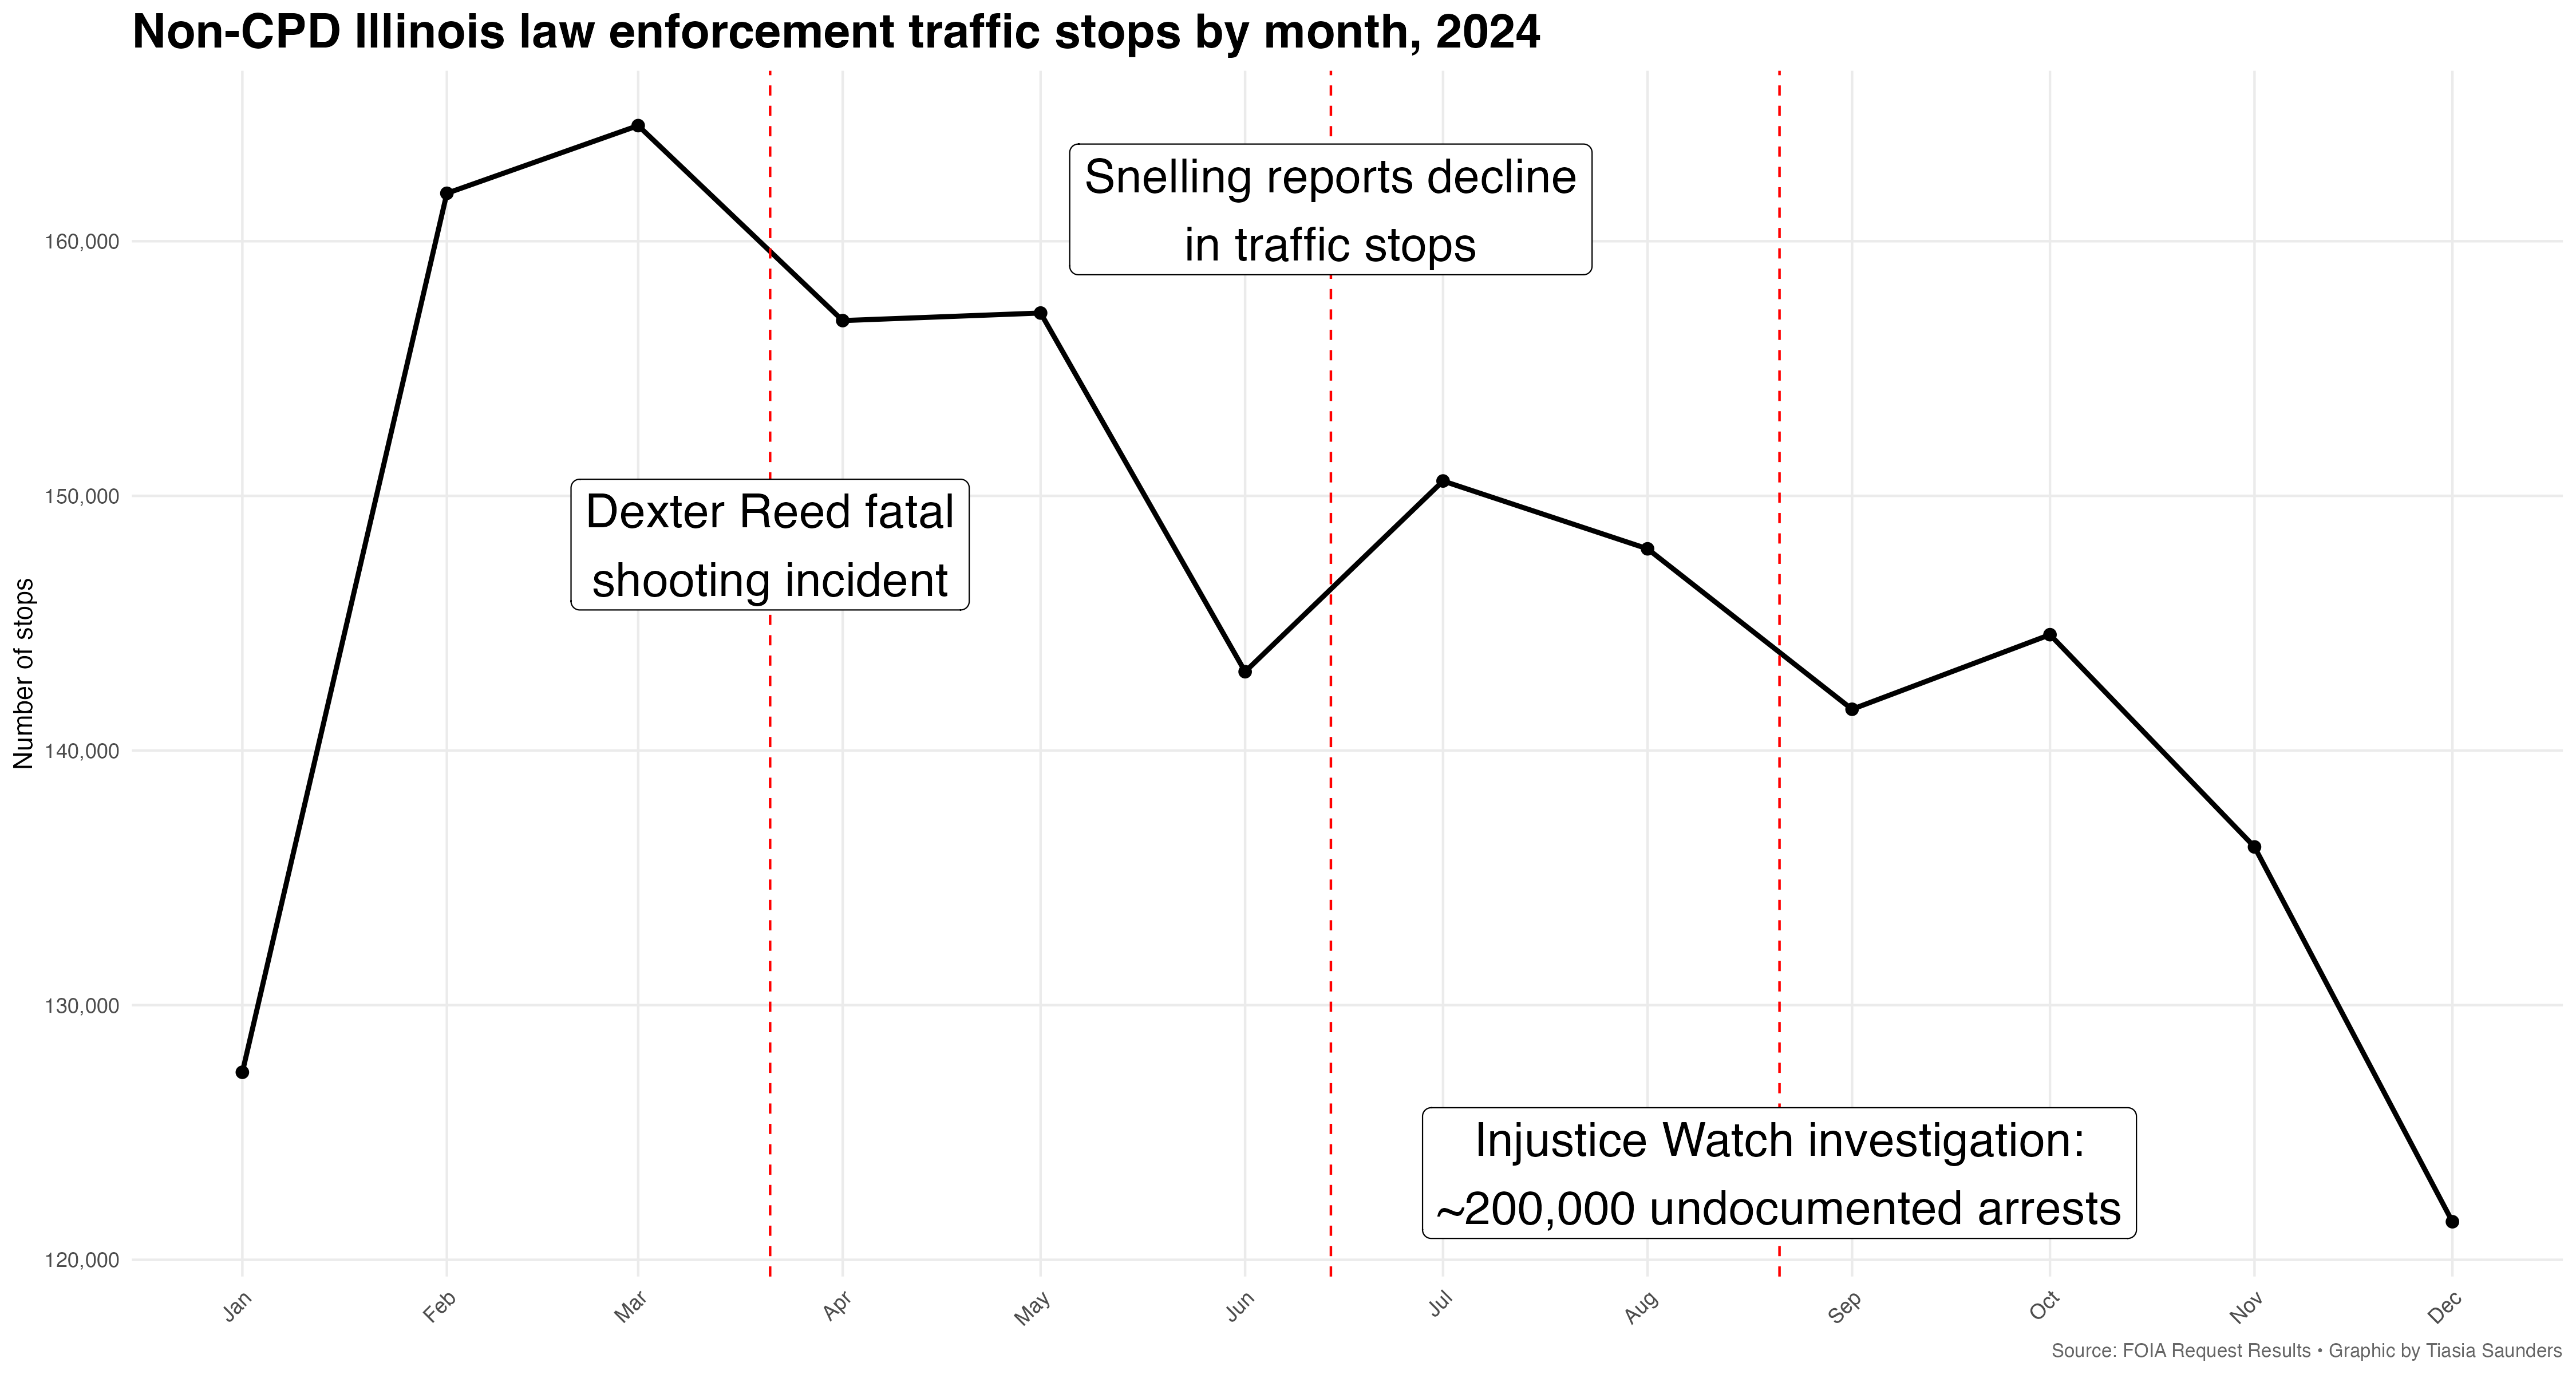
  • Tracks statewide law enforcement agency comparison
  • There are 786 different law enforcement agencies in the data.
  • The decline in June could be related to the 200,000 undocumented traffic stops and on this day Chicago Police Superintendent announced at a press release the decrease in traffic stops.

Per-Capita Traffic Stop Analysis

Chicago Police Department

Chicago Police Department per capita traffic stop rates by race
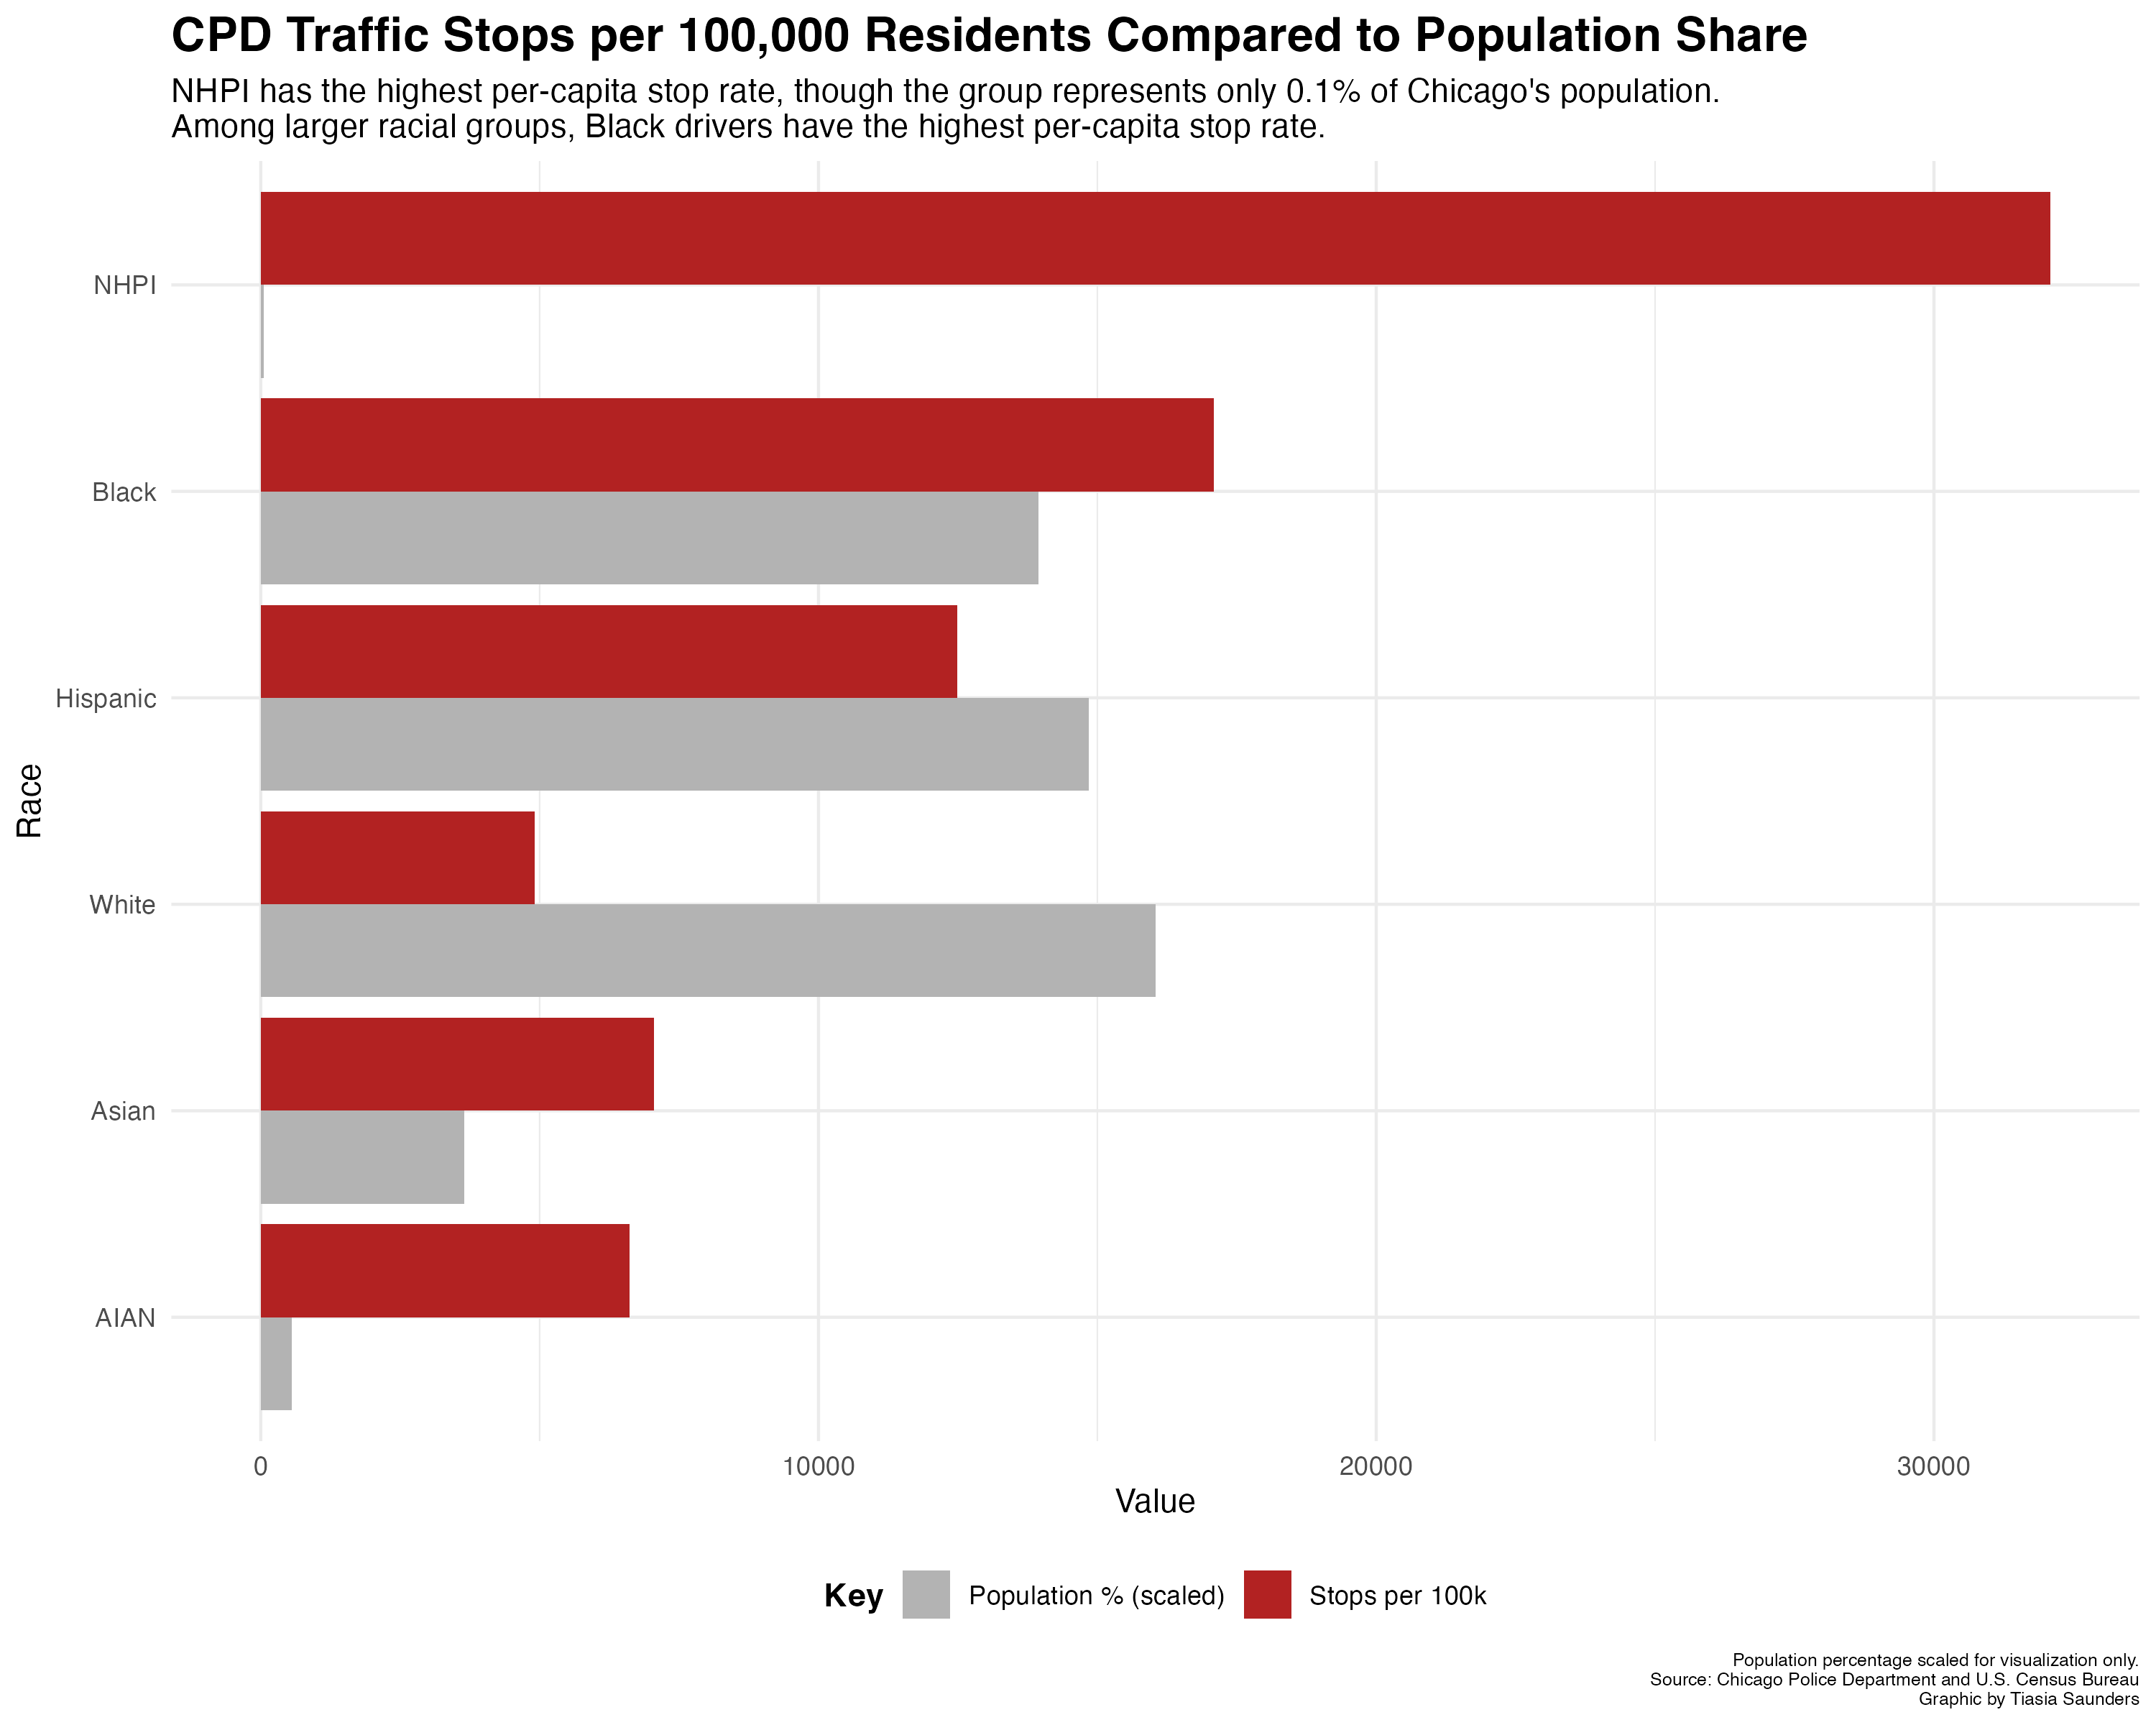
  • Shows stop rates adjusted for racial population size which helps identify disparities hidden by raw counts
  • When accounting for race population size, it shows me that Native Hawaiian and Pacific Islander (NHPI) drivers had the highest per capita rate of traffic stops in 2024, with 32,083 stops per 100,000 residents, but this is mainly due to the small NHPI population size.
  • Black drivers had the second highest per capita rate with 17,088 stops per 100,000 residents, followed by Hispanic drivers with 12,492 stops per 100,000 residents.
  • White drivers had the lowest per capita rate of 4,912 stops per 100,000 residents.
  • Asian drivers had a per capita rate of with 7,052 per 100,000 residents.
  • American Indian drivers had a per capita rate of 6,610 stops per 100,000 residents.

Other Illinois Law Enforcement Agencies

Illinois law enforcement per capita traffic stop rates by race
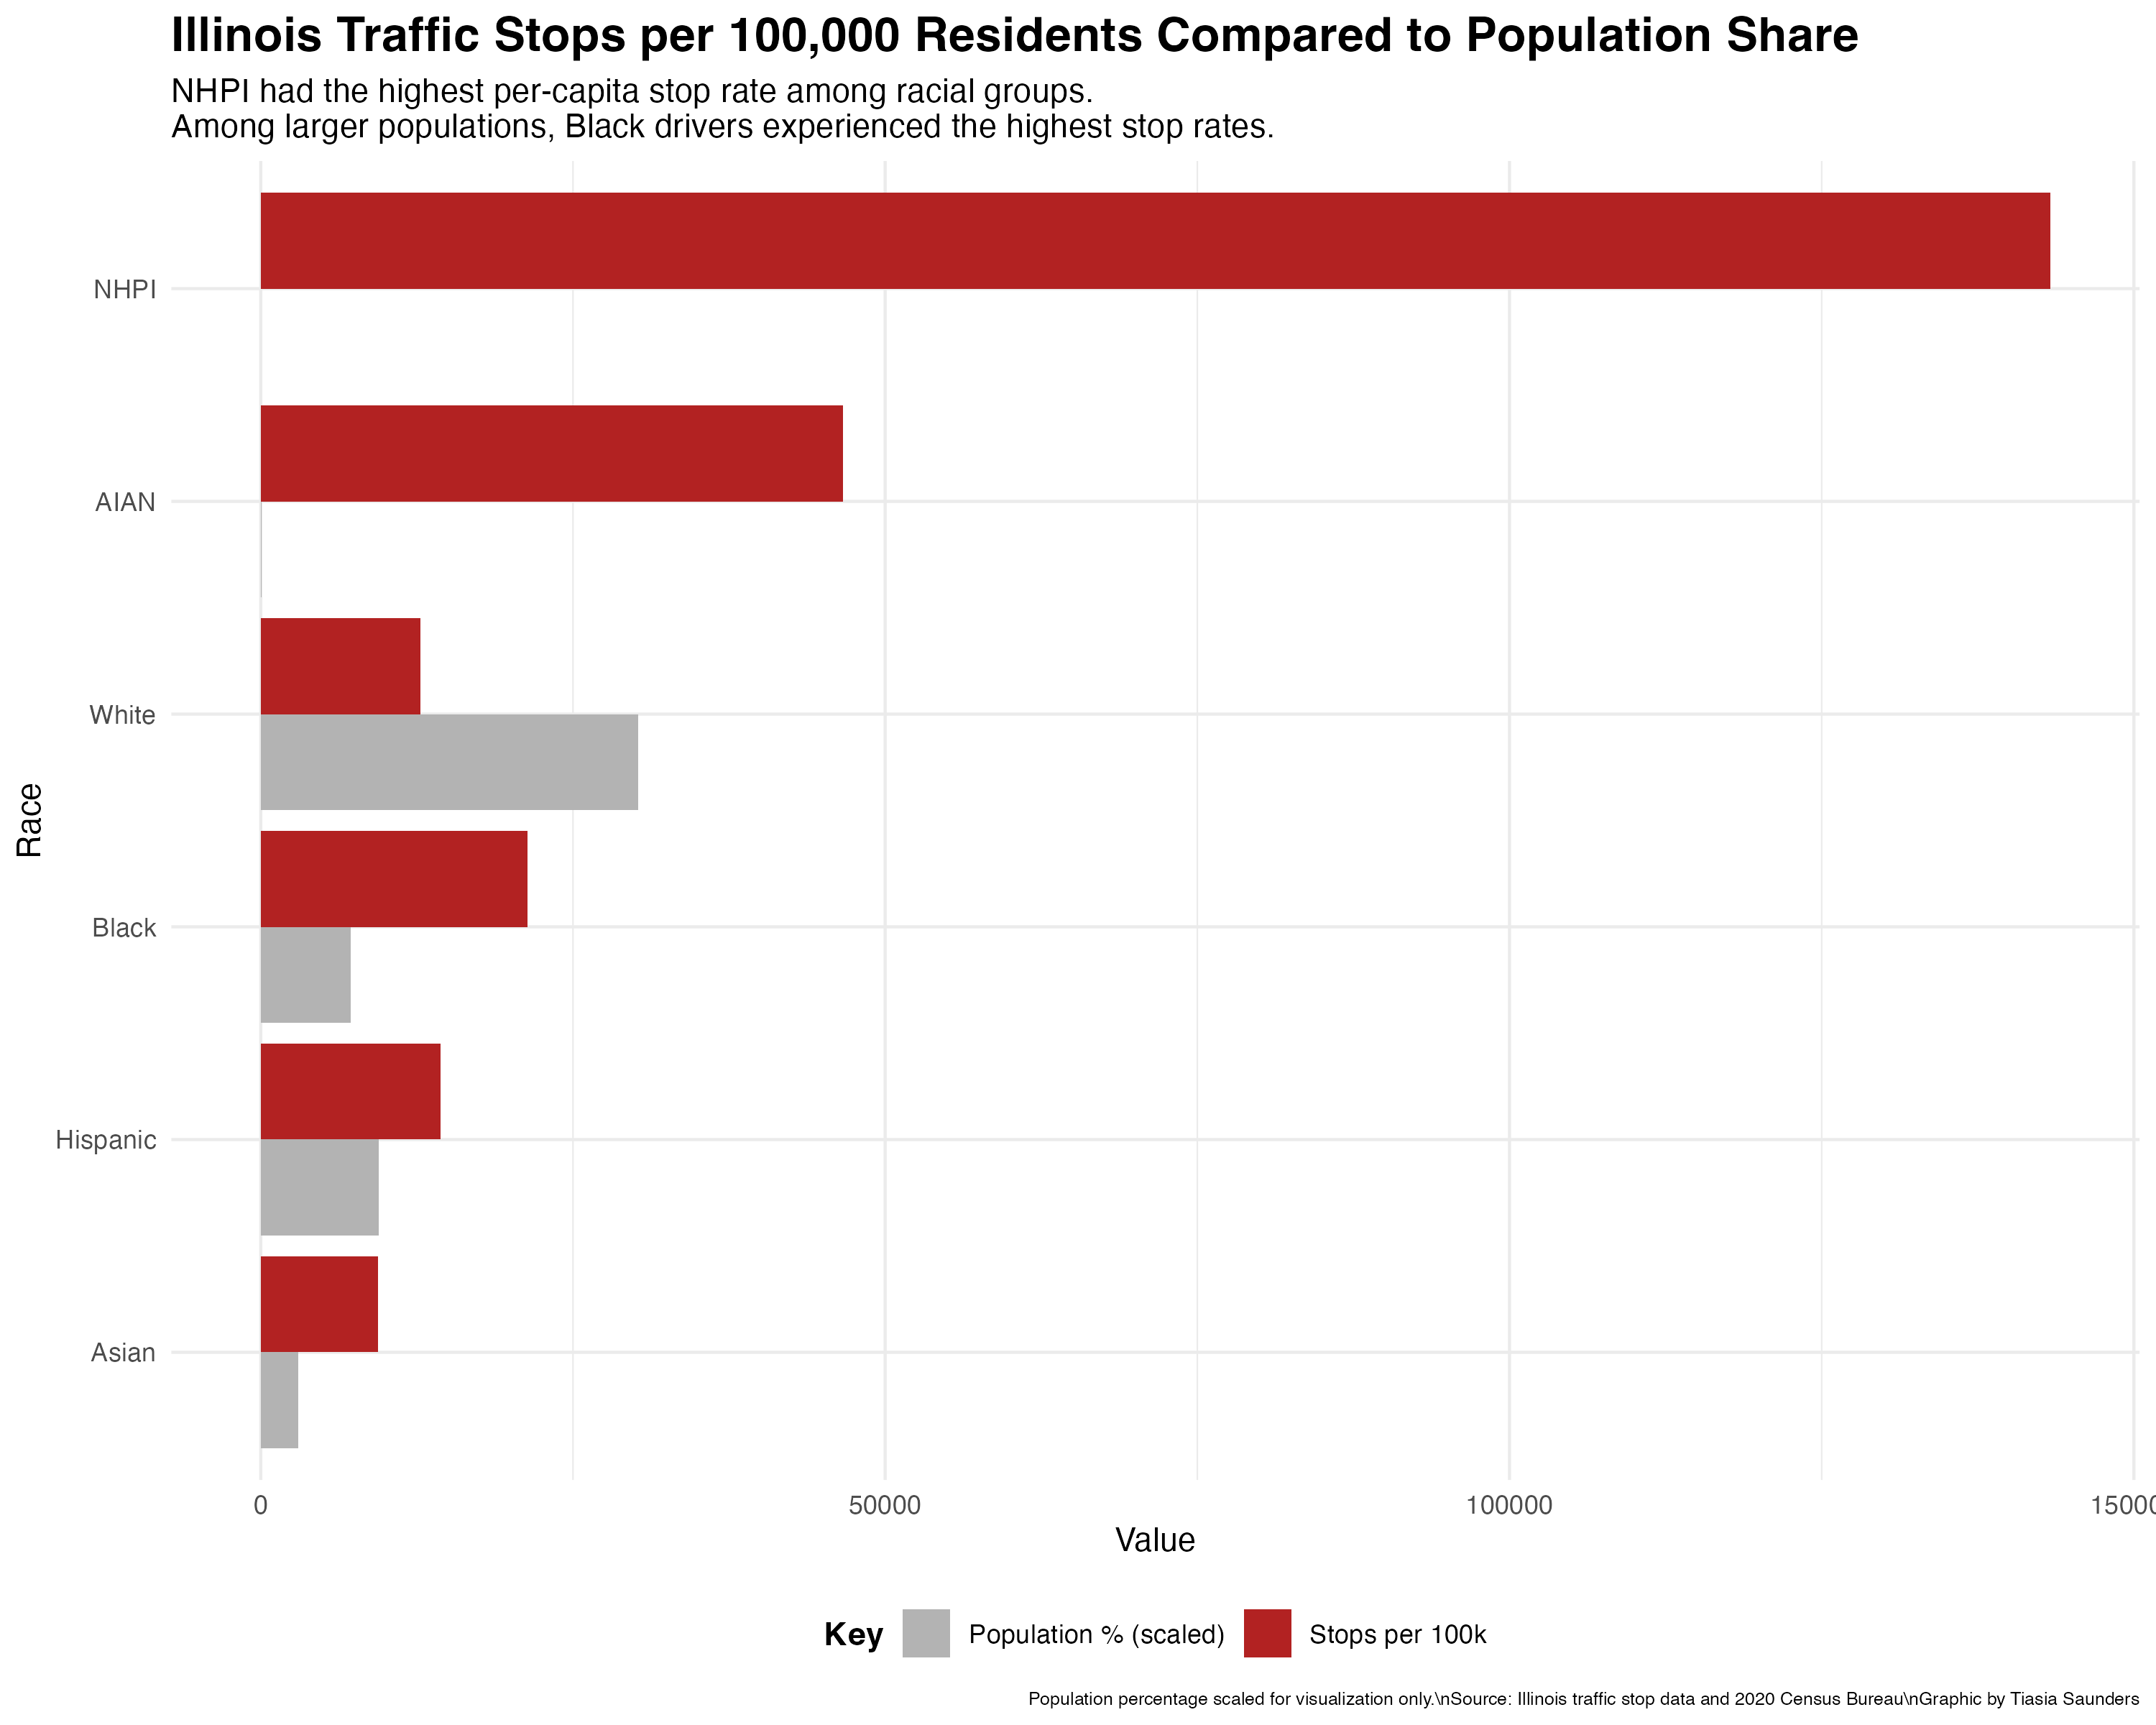
  • Compares statewide traffic stop of hundreds of law enforcement agencies
  • Illinois state traffic stop rates were highest among NHPI and American Indian residents, though those rates are based on much smaller population counts.
  • Among larger racial groups, Black residents had the highest stop rate, with about 21,373 stops per 100,000 residents, compared with 12,779 per 100,000 white residents.
  • Following that, Hispanic residents made up 12,779 stops per 100,000 reesidents, while Asian had the lowest per capita with 9,415 traffic stops of 100,000 residents.

Chicago Police Department Heatmap

Illinois Law Enforcement Agencies Heatmap

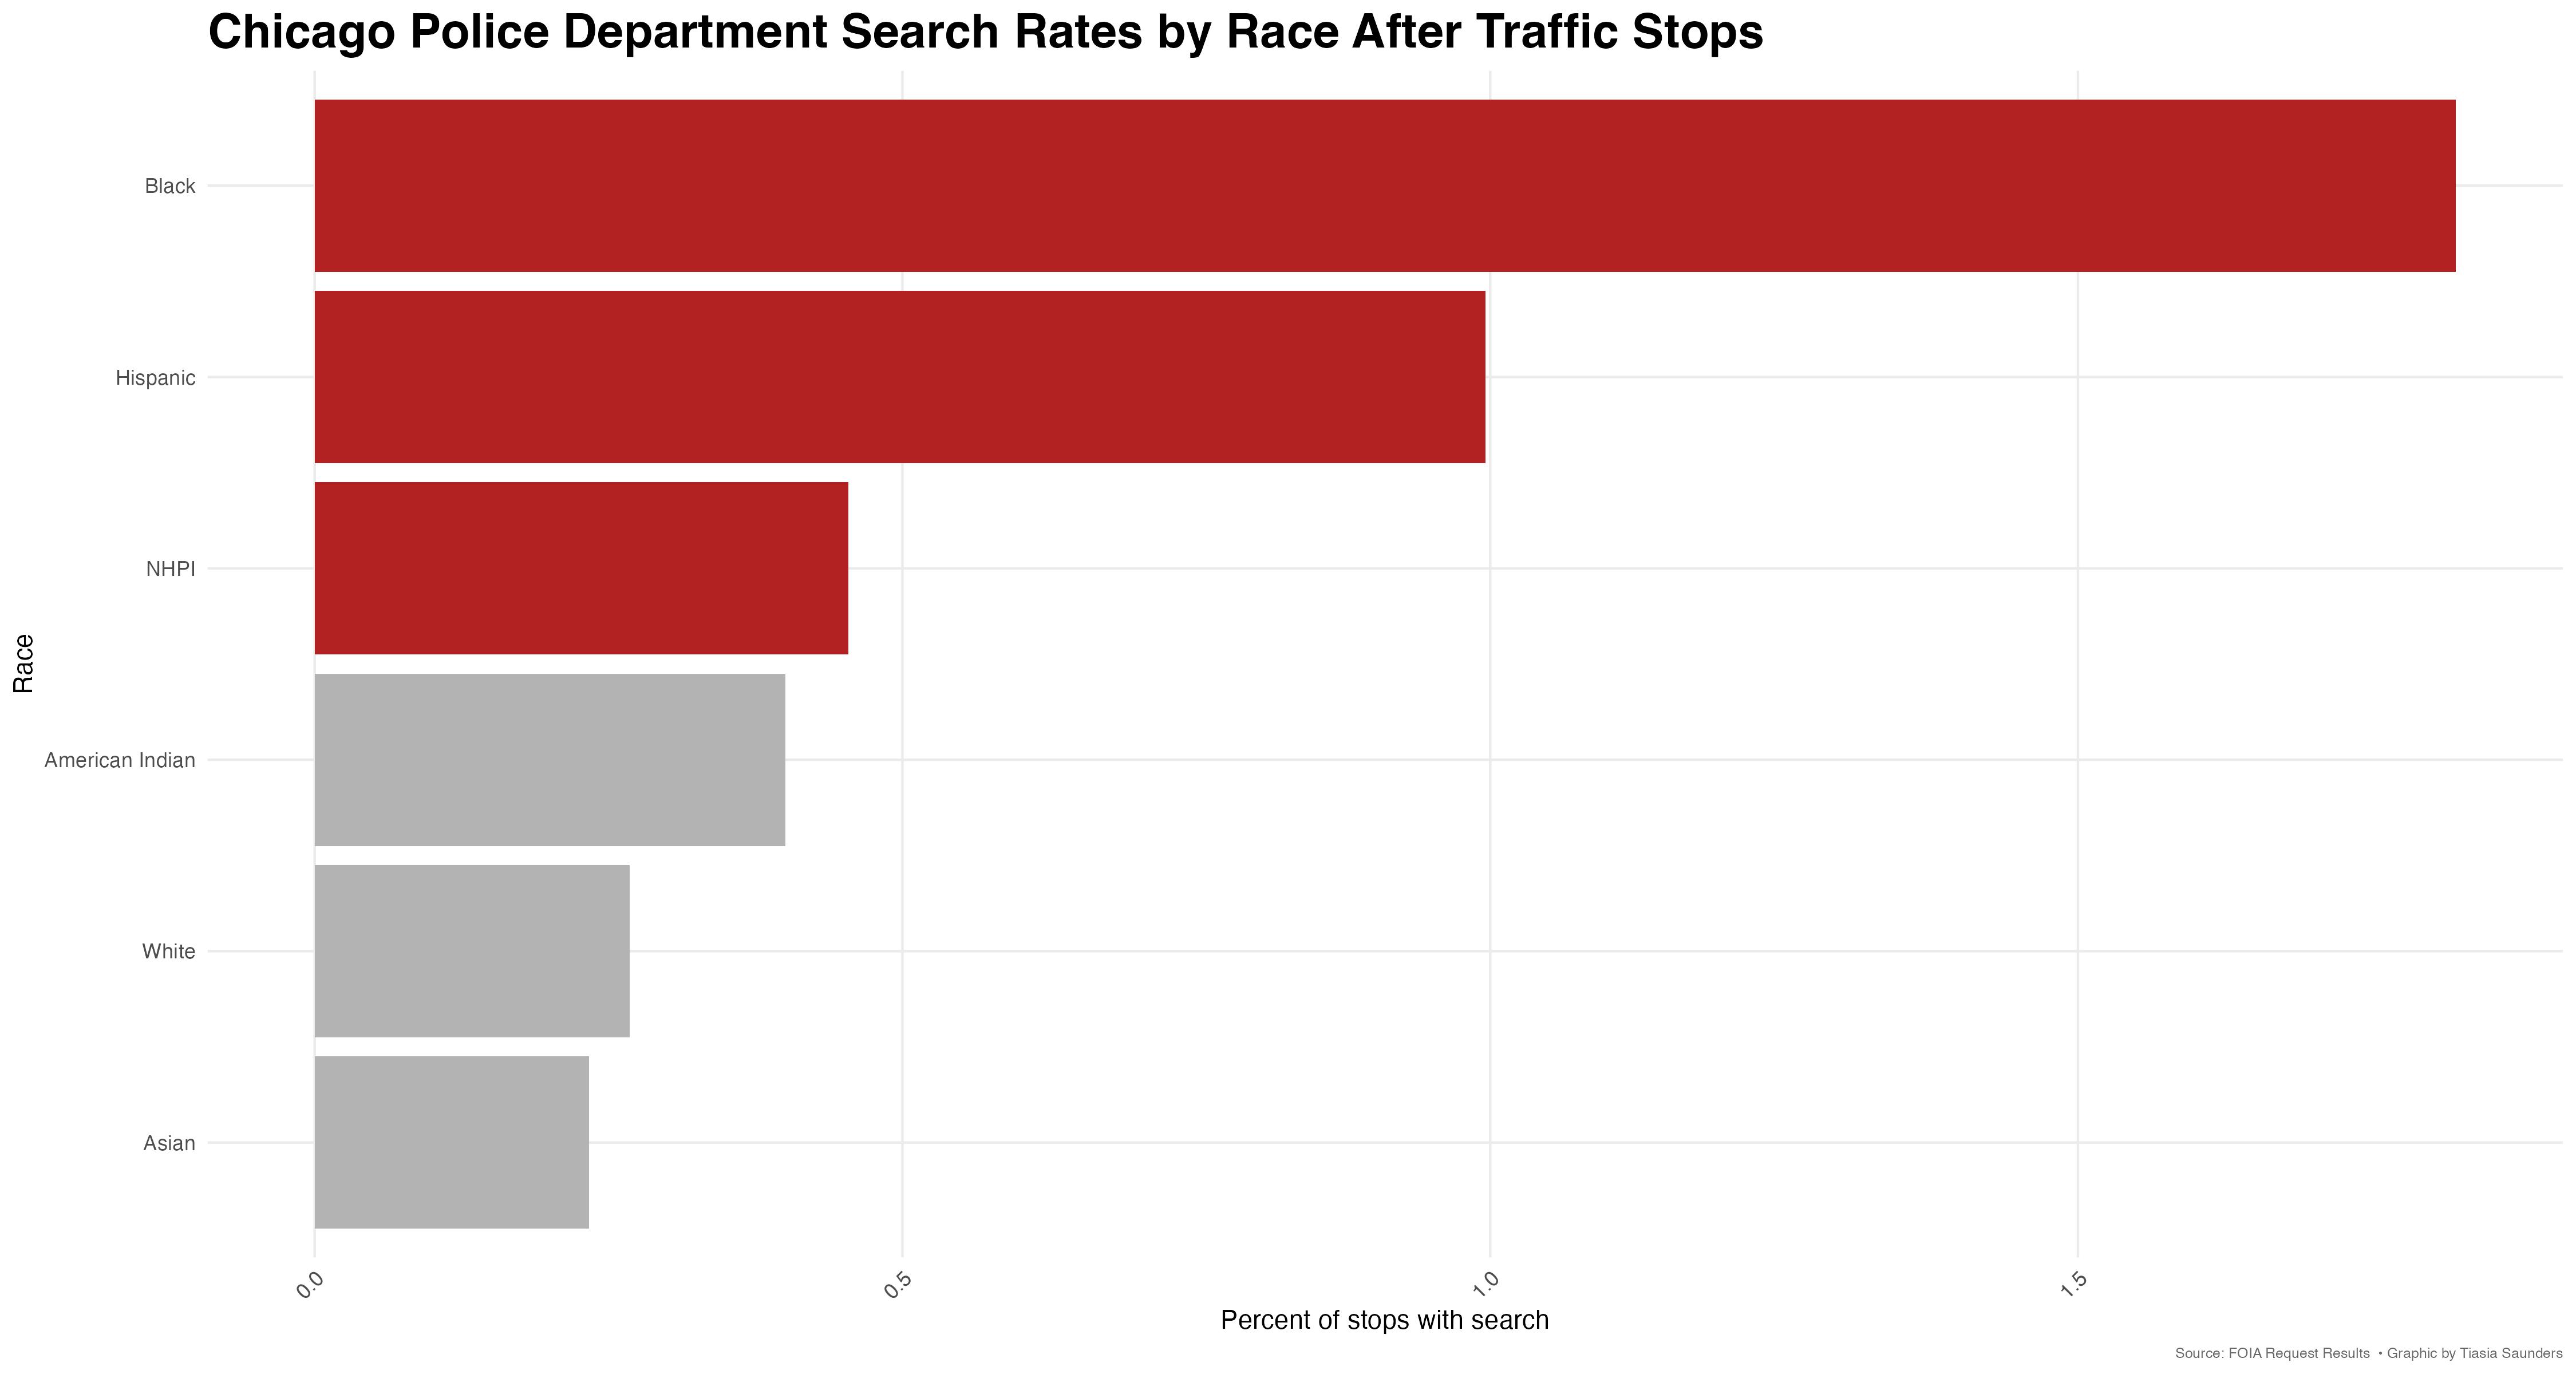
Chicago Search Rates

Chicago Search Rates

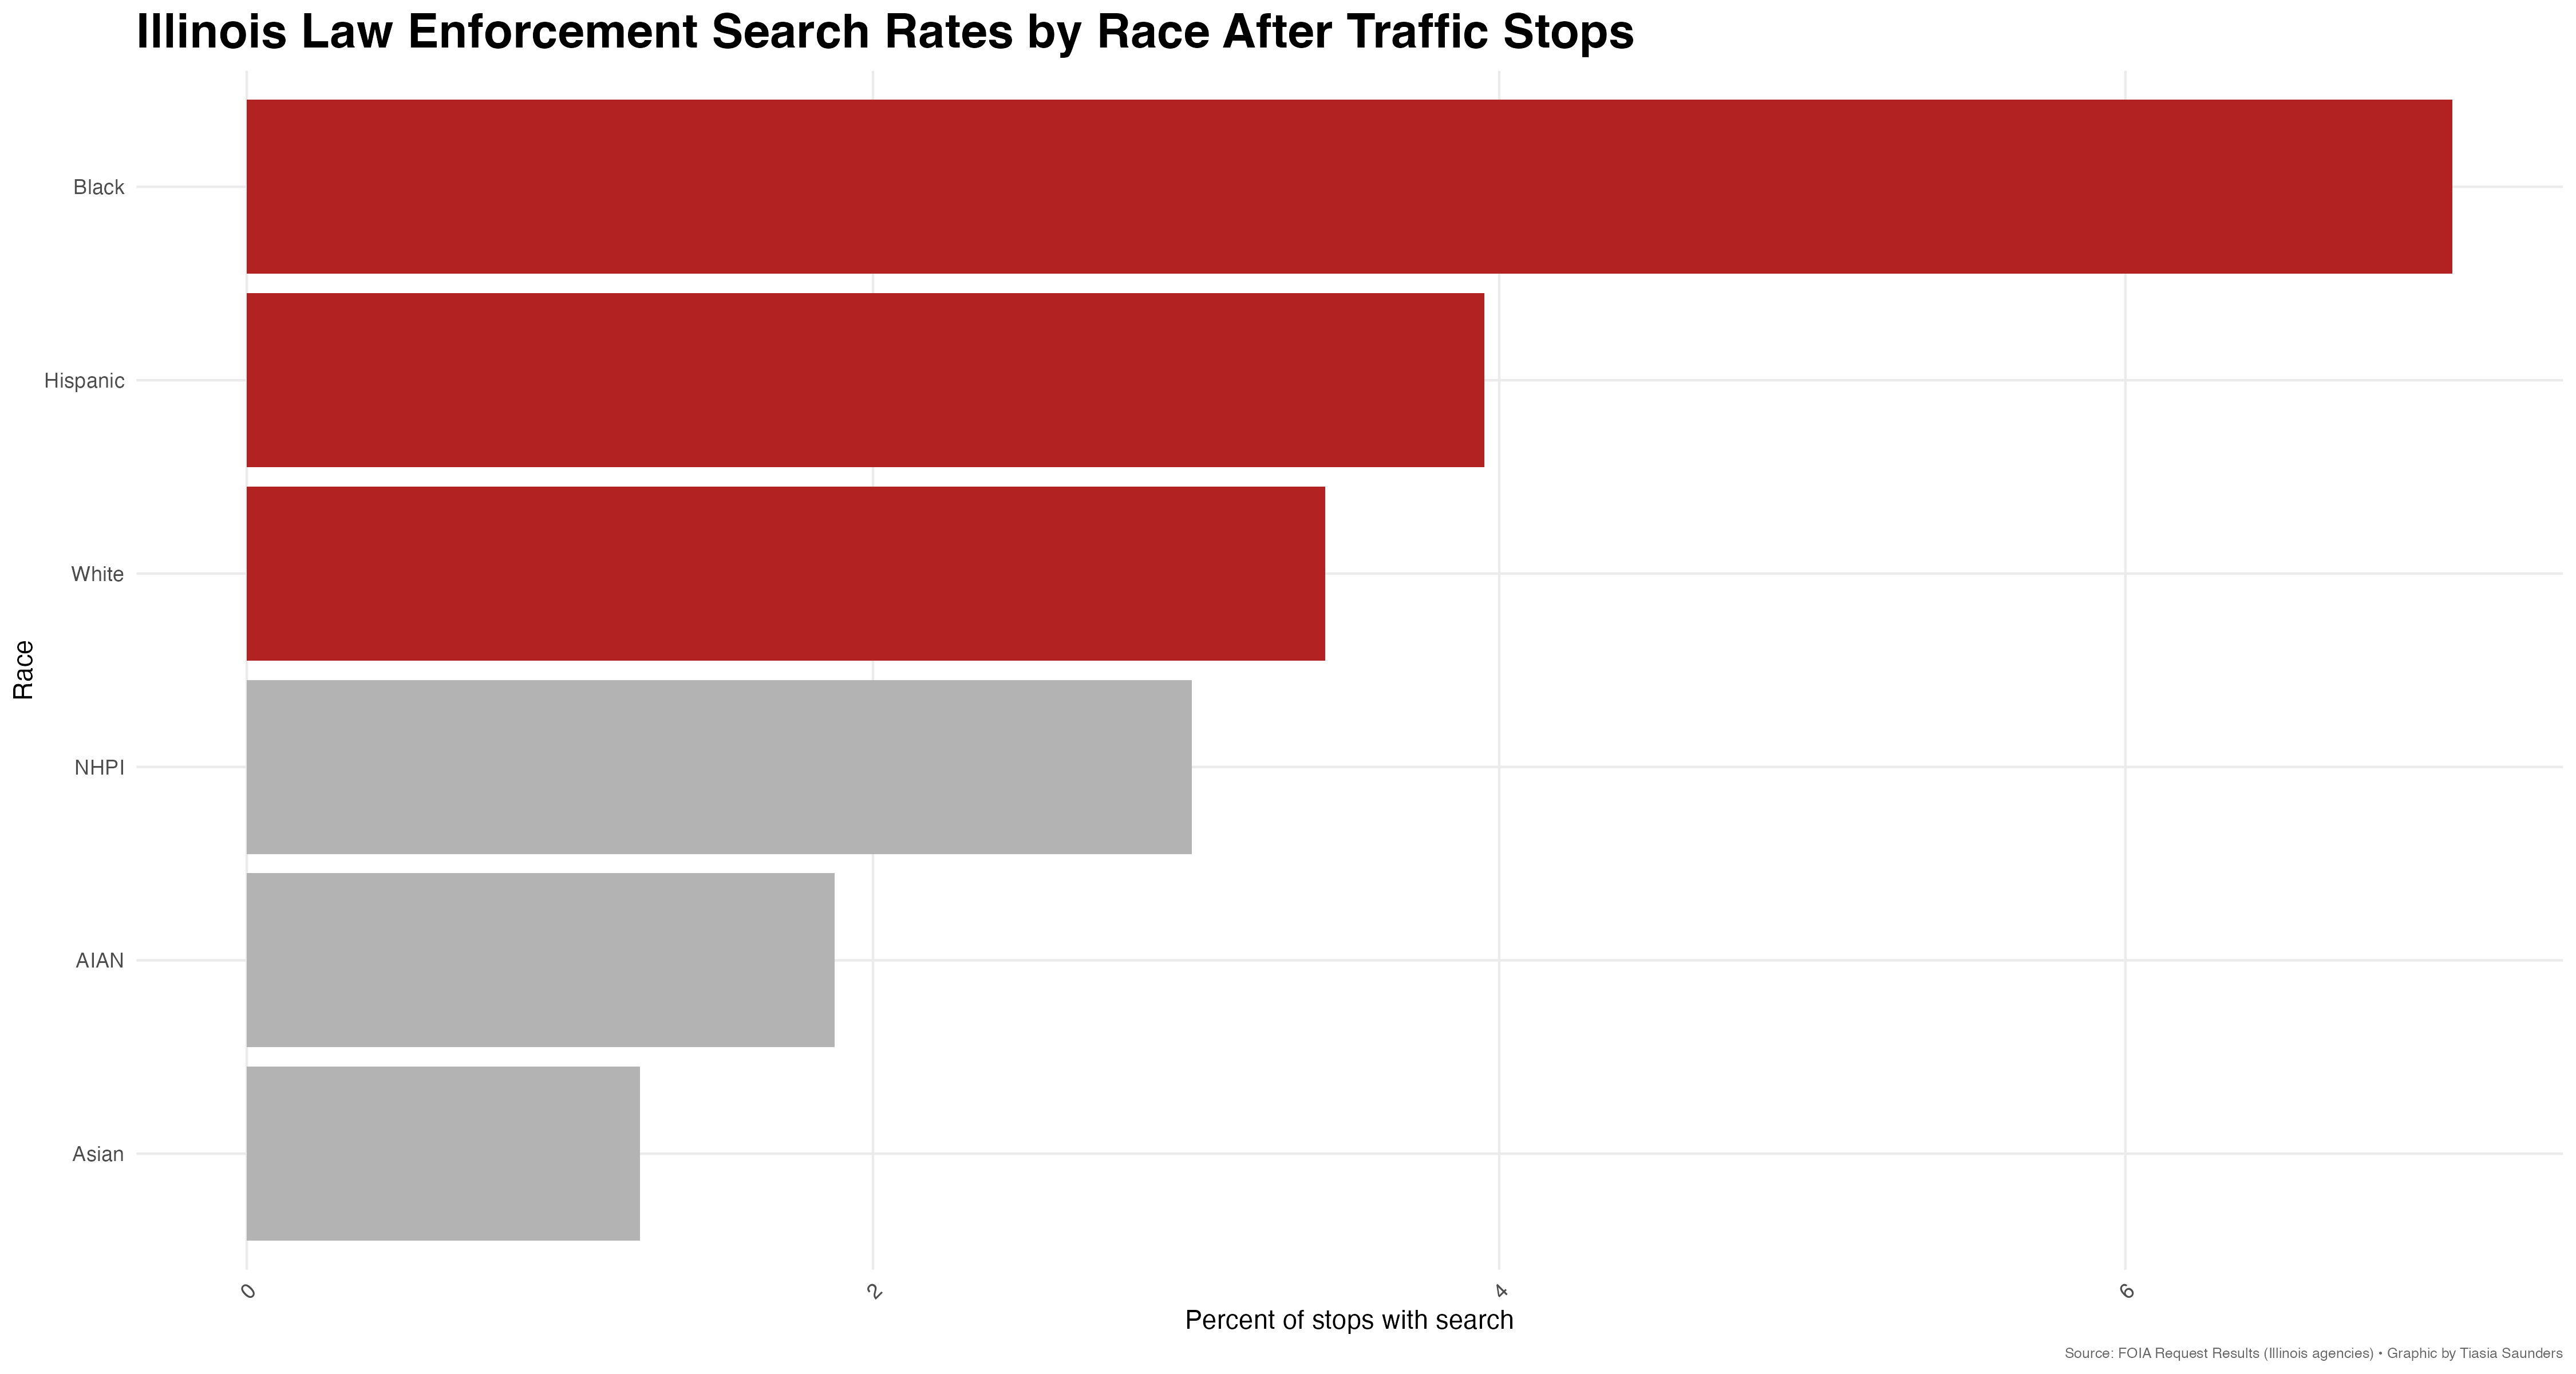
Illinois Search Rates

Illinois Search Rates

Veil of Darkness Analysis

Chicago Police Department

CPD Veil of Darkness Analysis
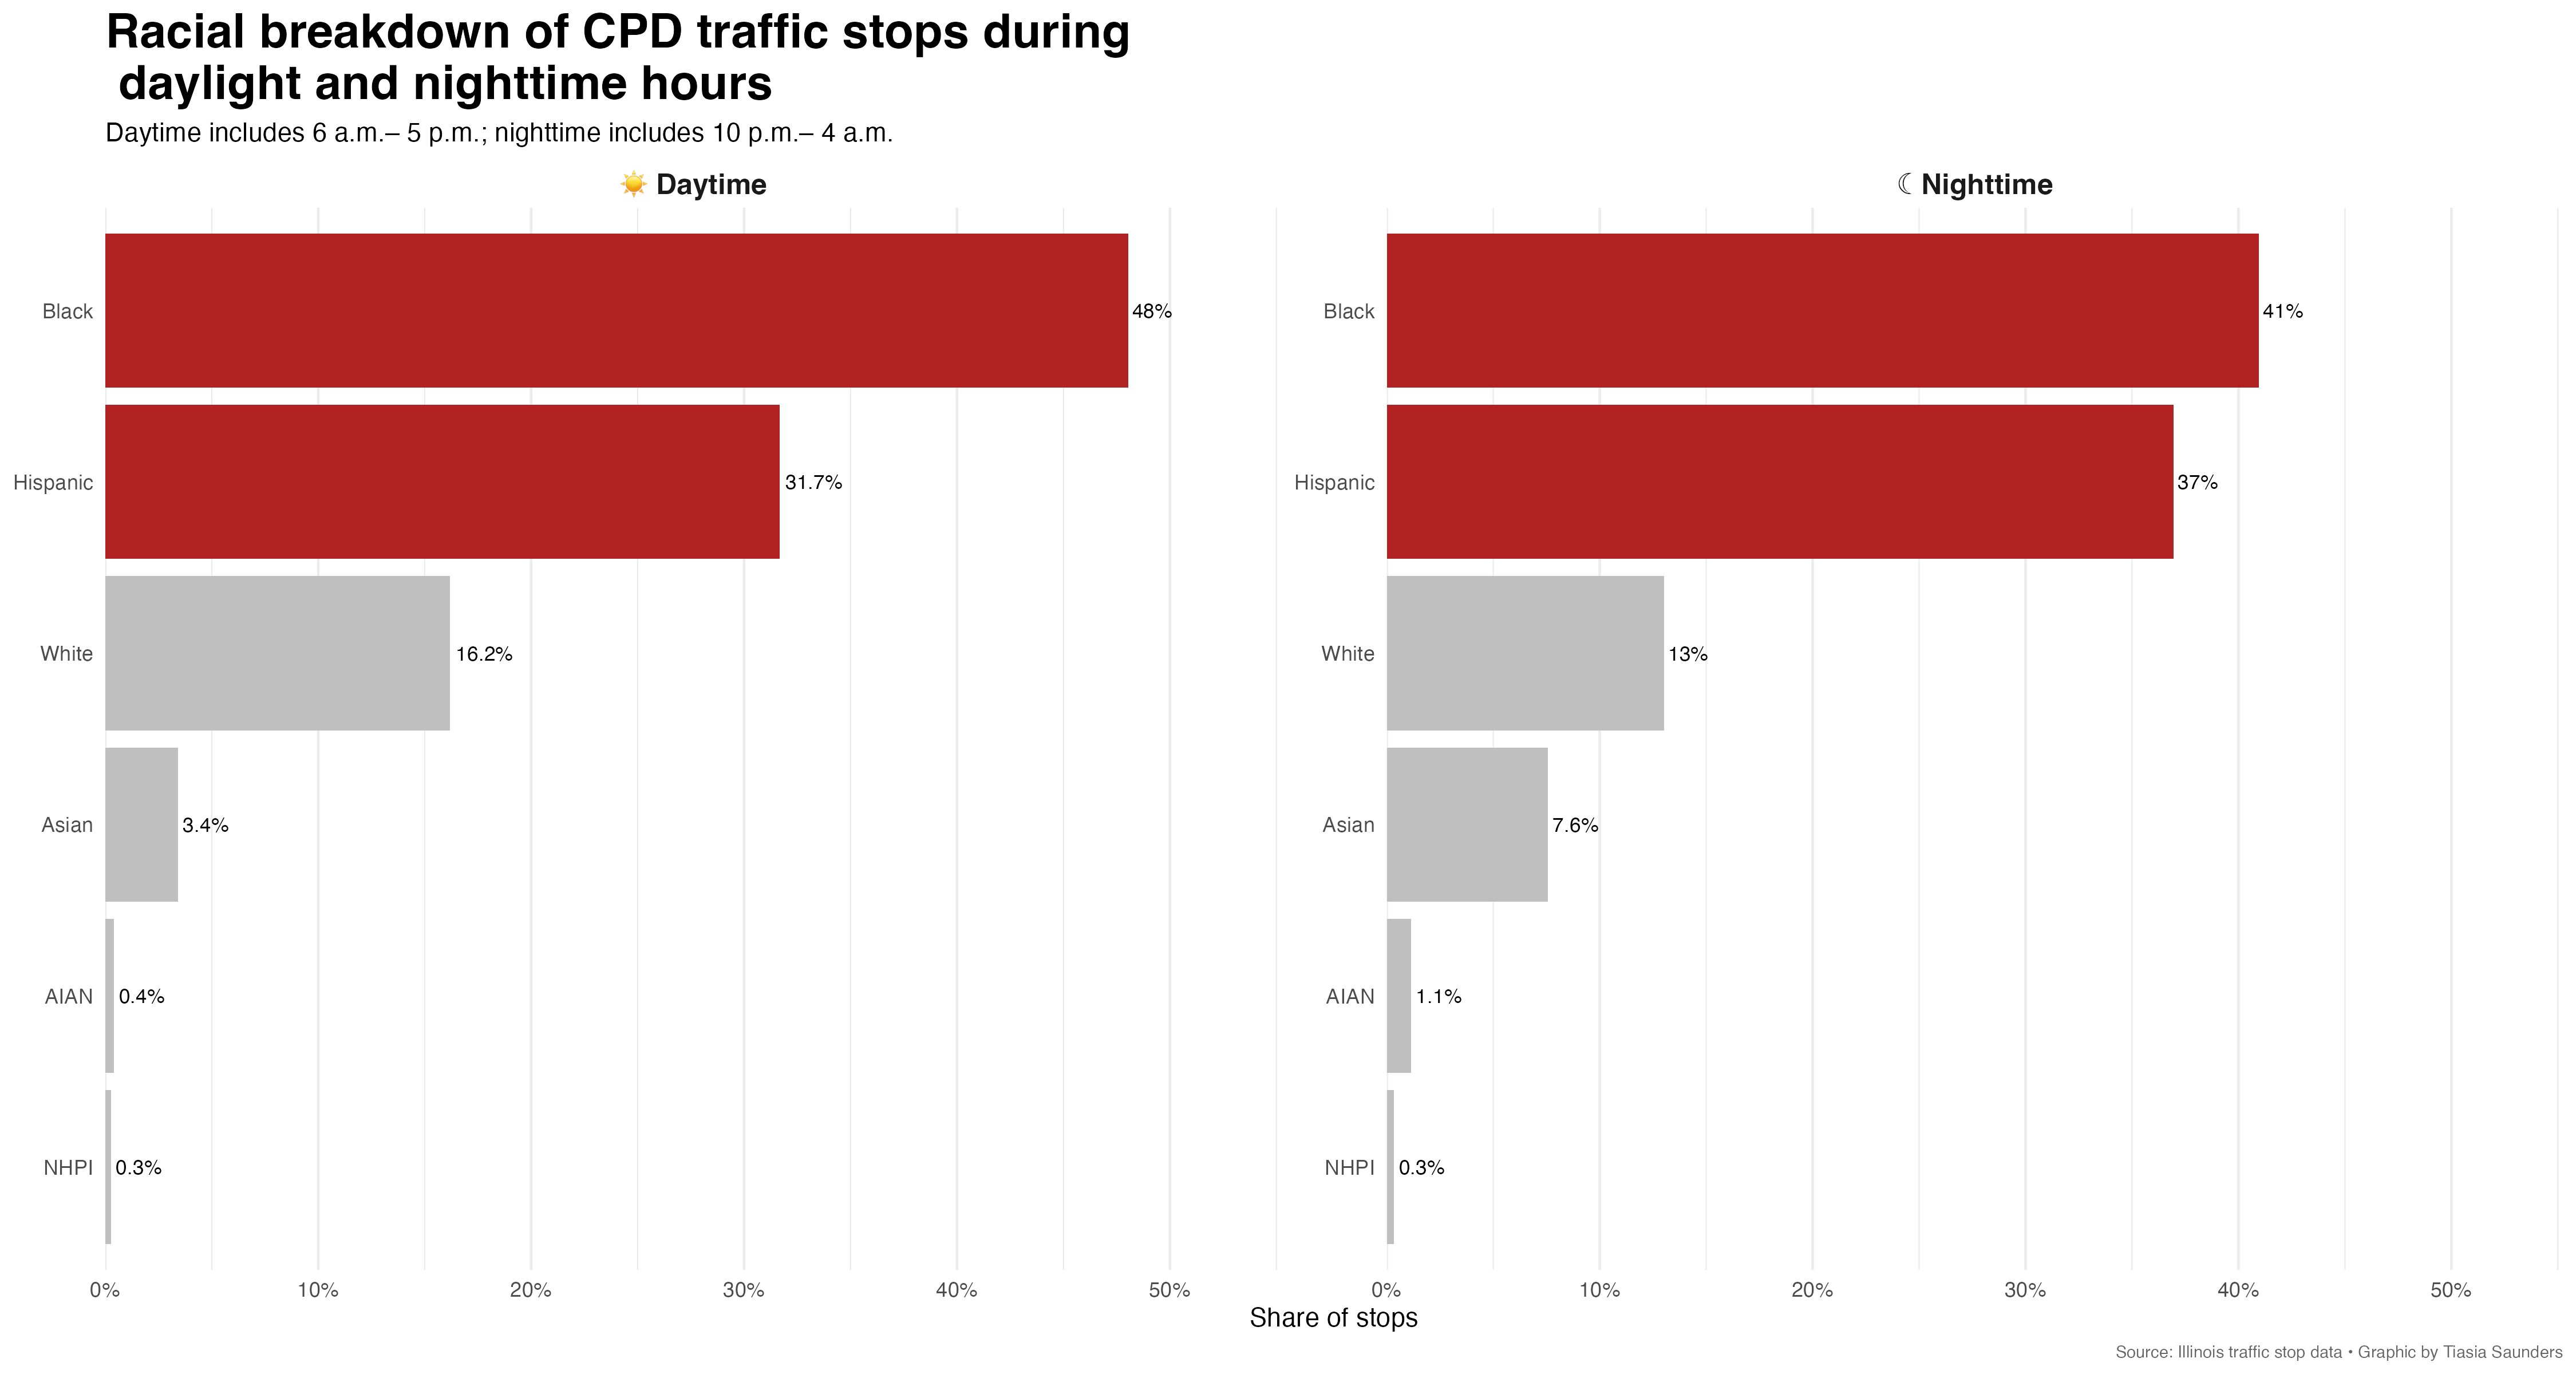
  • Black drivers accounted for the largest share of Chicago traffic stops during both daytime (48.0%) and nighttime (41.0%) hours. Additionally, it followed the suspected pattern of veil of darkness through the traffic stop percentage dropping by 7% at nighttime.
  • Hispanic drivers' share increased from 31.7% during the day to 37.0% at night.
  • White drivers accounted for 16.2% of daytime stops and 13.0% of nighttime stops, which follows a veil of darkness lens through police not recoginizing the drivers race at nighttime, but it descreased by 3.2%.
  • The racial distribution of stops in Chicago differs substantially from statewide Illinois traffic-stop patterns, where White drivers make up the majority of stops.

Illinois Law Enforcement Agencies

Illinois Veil of Darkness Analysis
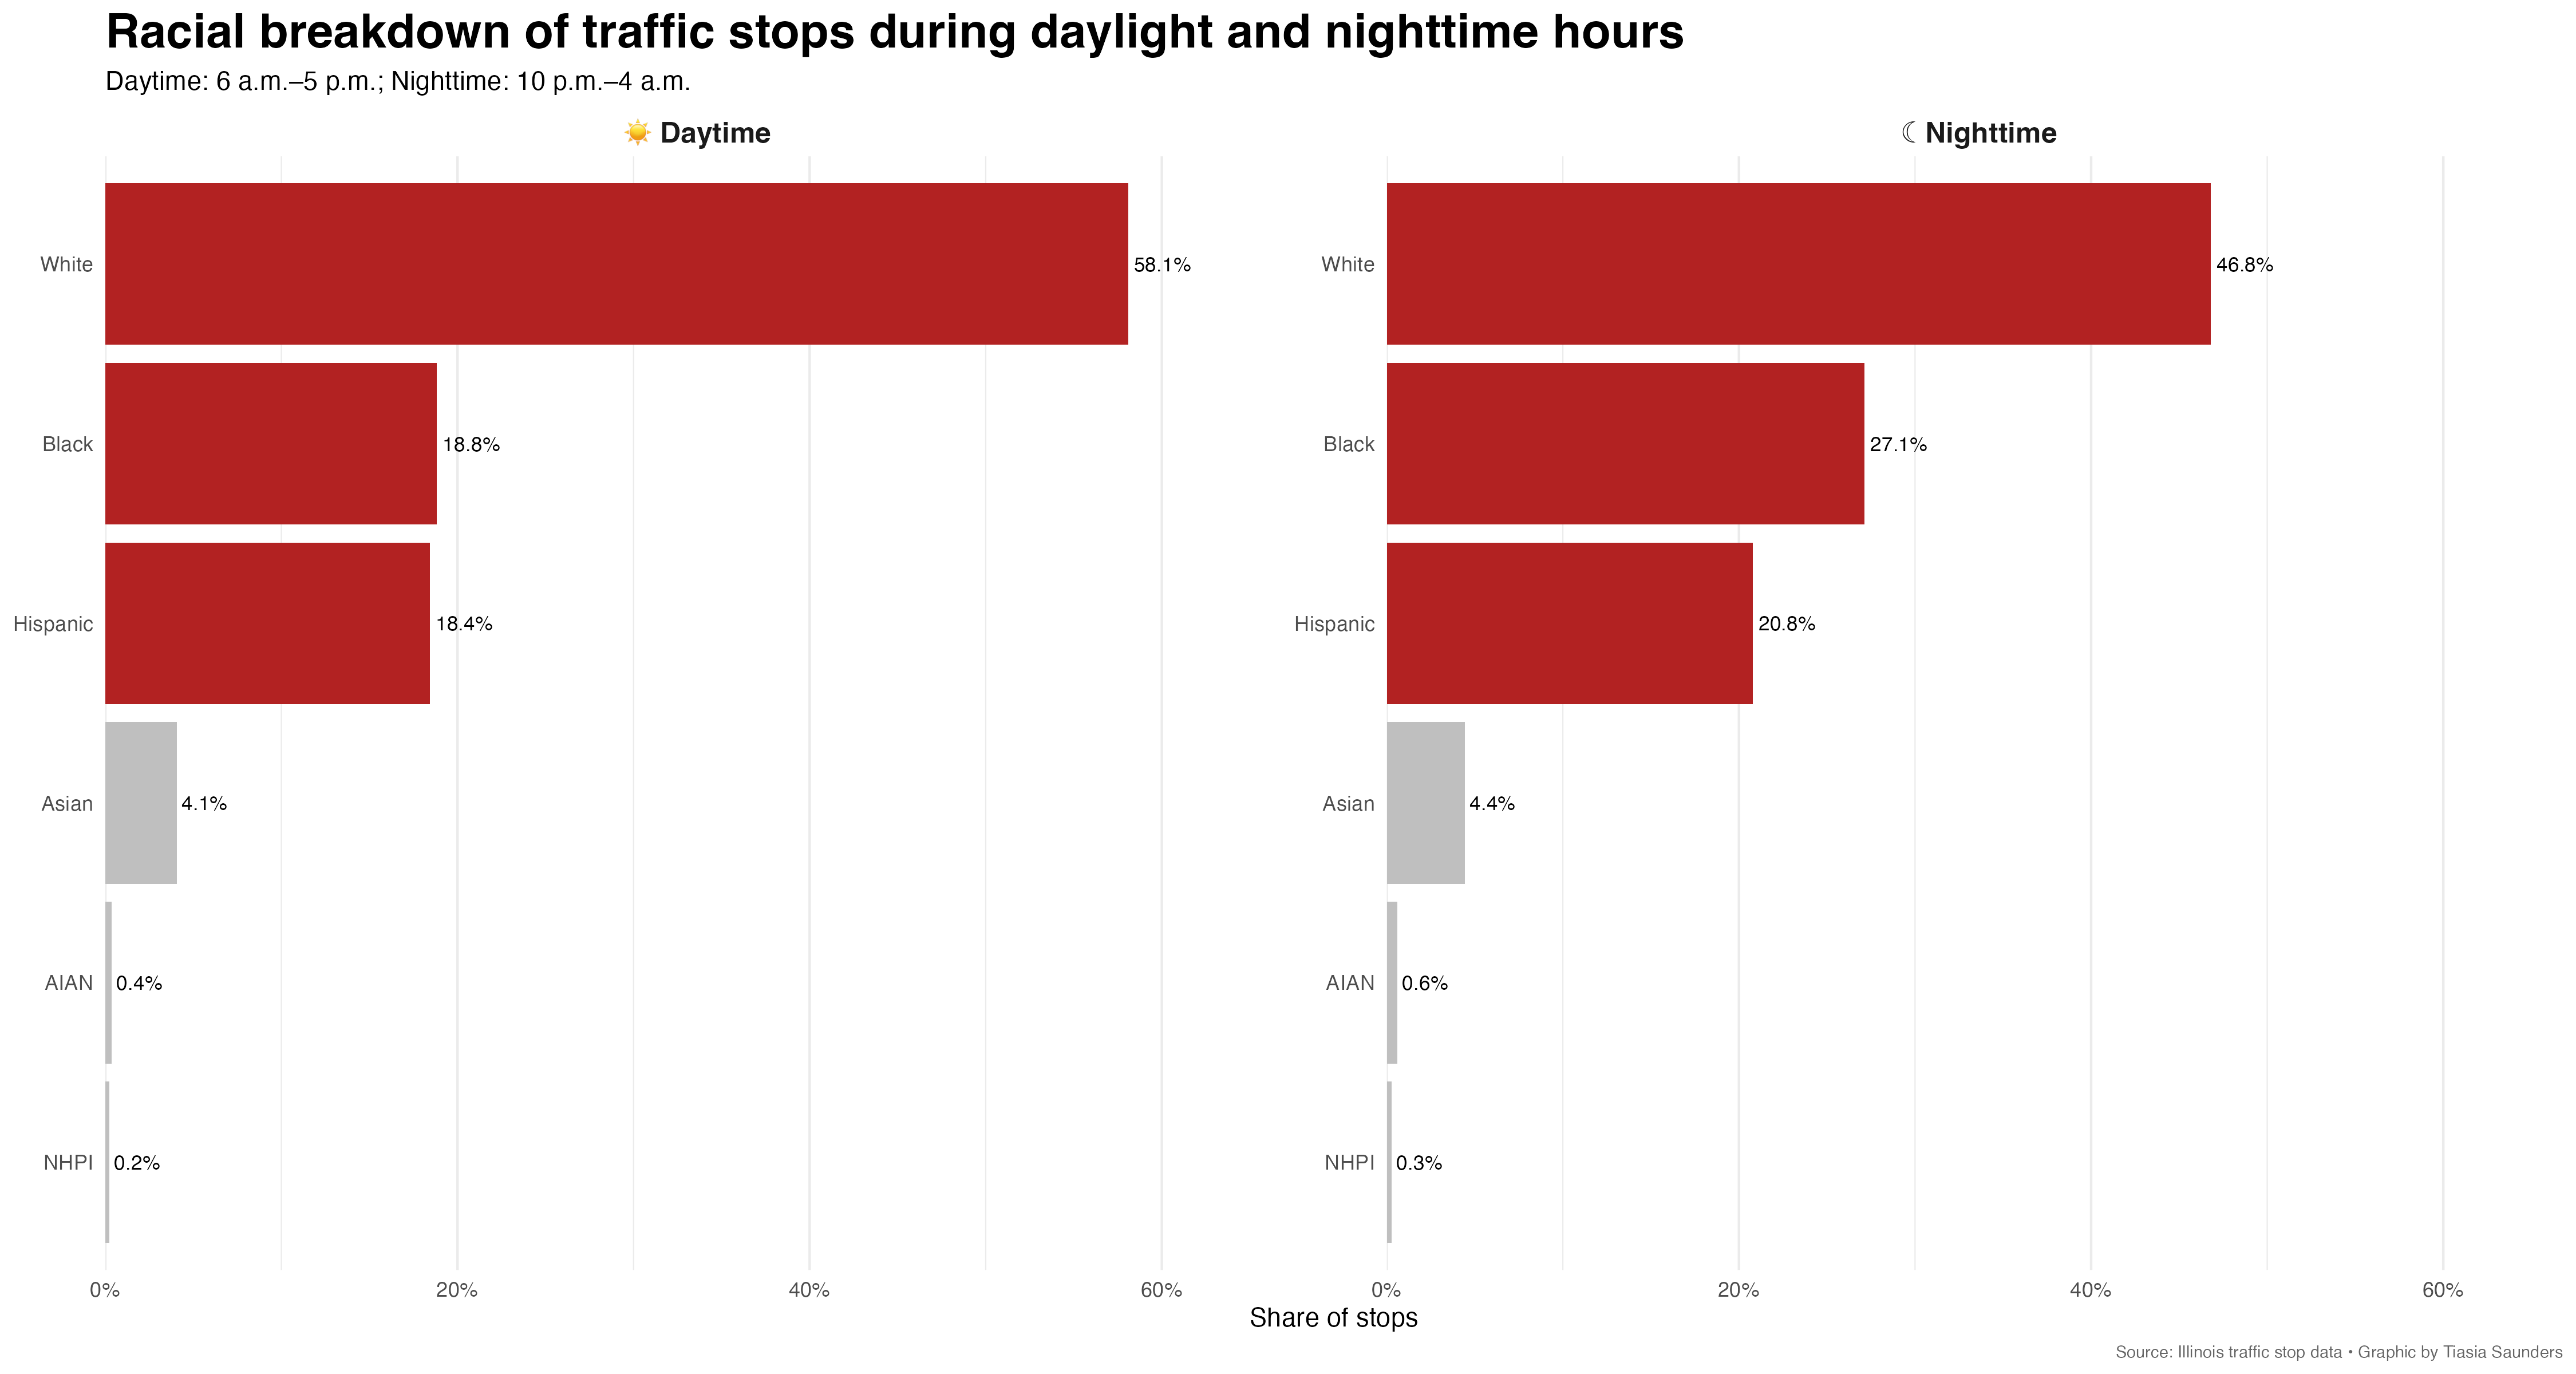
  • Statewide agencies show similar but more distributed stop patterns.
  • Black drivers accounted for 18.8% of daytime traffic stops but 27.1% of nighttime stops, representing an increase of 8.3 percentage points (about a 44% increase in stop share at night).
  • White drivers accounted for 58.1% of daytime stops but dropped to 46.8% at night, representing an 11.3 percentage point decrease (about a 19.5% decline in stop share after dark).
  • Hispanic drivers also saw an increase in stop share, rising from 18.4% during daytime hours to 20.8% at night, while Asian, AIAN, and NHPI stop shares remained relatively stable across lighting conditions.
  • These findings do not align neatly with the traditional Veil of Darkness expectation that minority drivers would account for a smaller share of stops when visibility is reduced. Instead, Black and Hispanic drivers represented a larger share of nighttime stops, suggesting that other factors beyond driver visibility may influence statewide traffic stop patterns.
  • Because this analysis uses fixed daytime and nighttime categories rather than actual sunrise and sunset times, these results should be interpreted cautiously and viewed as descriptive rather than causal evidence against or for the Veil of Darkness framework.

Illinois Agencies Pattern

Illinois Veil of Darkness Analysis

Key Takeaway

Conclusion:

How I Could Expand This Project