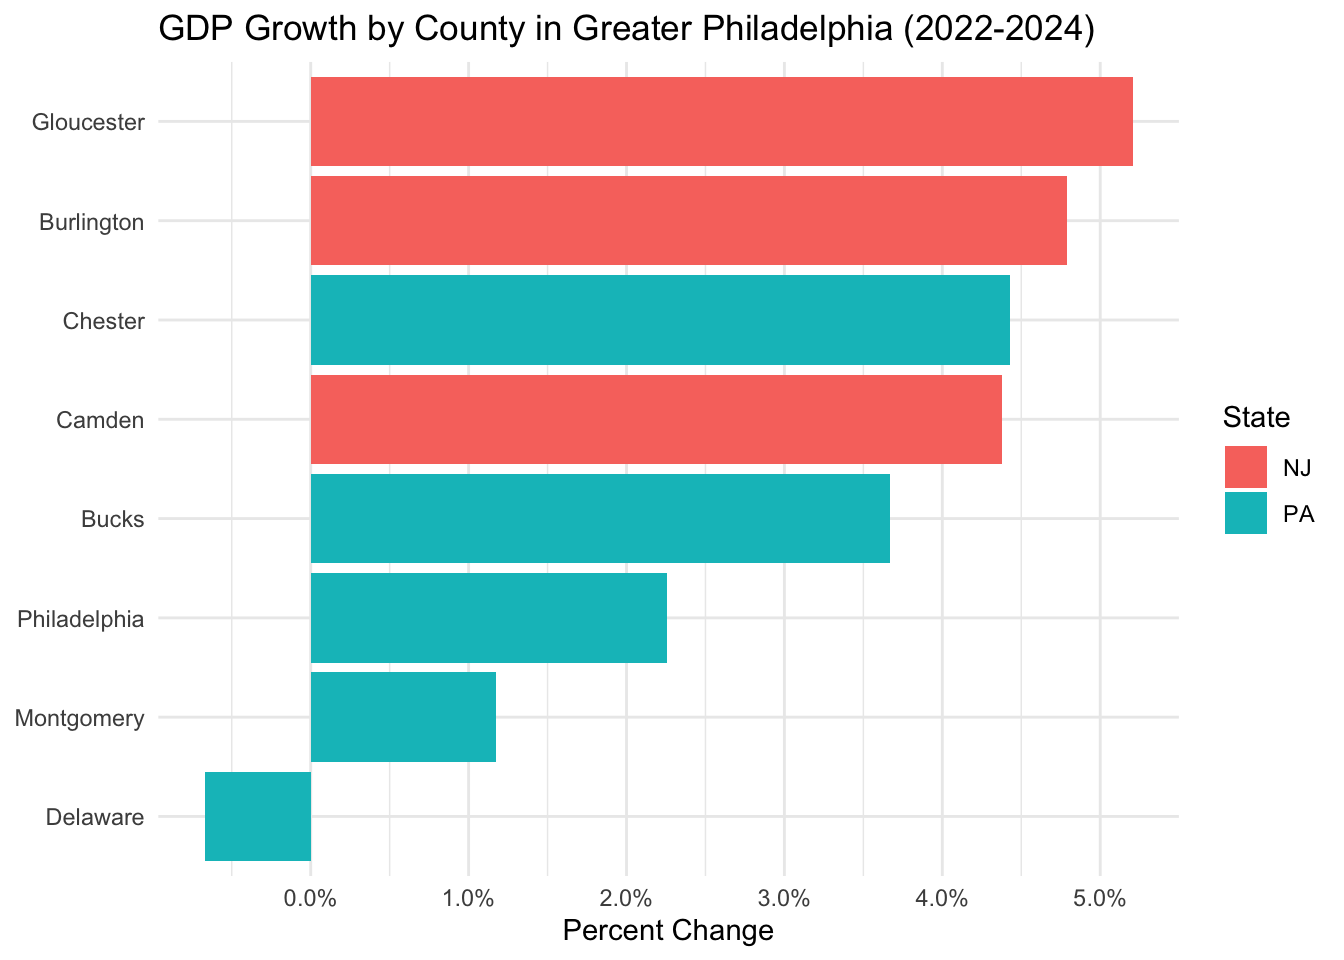
Why Is Delaware County the Only Shrinking Economy in Greater Philadelphia?

—- Economic Portrait of Greater Philadelphia

Author
Published

2026-06-06 01:41

Overview

The Bureau of Economic Analysis (BEA) released its 2024 county-level GDP data on February 5, 2026, offering the most current picture of how the greater Philadelphia region’s economy has shifted.

This project uses BEA county-level GDP data and Bureau of Labor Statistics(BLS) employment data to explore:

  • How is the overall GDP situation in the greater Philadelphia area?
  • Why is Delaware County the only county whose GDP shrank between 2022 and 2024? Which industries are driving that decline?
  • which sector in this industry saw the steepest drop?
  • How do residents’ personal incomes change?

What is this story about?

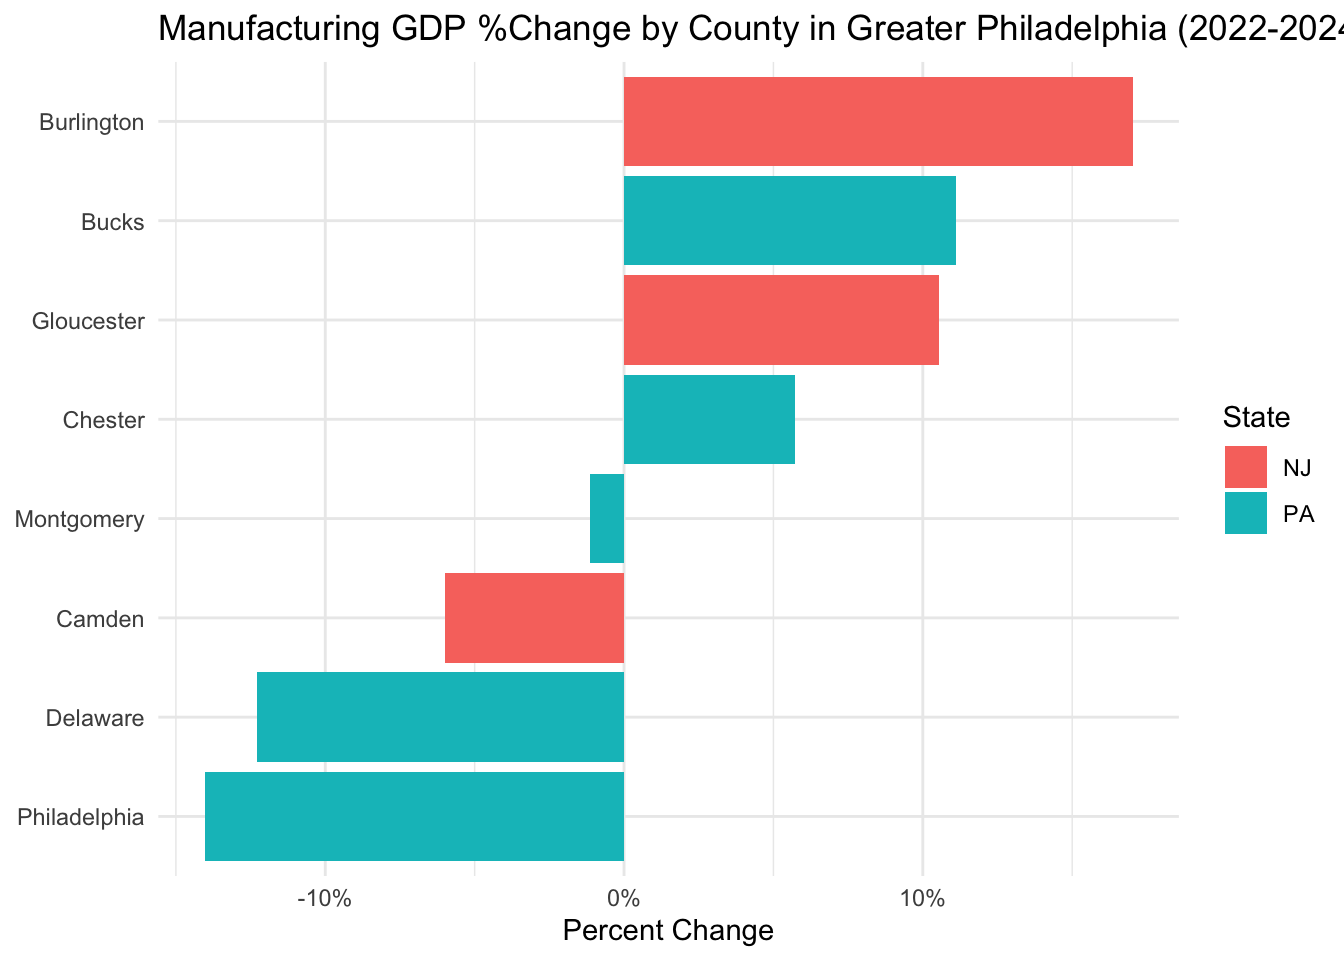
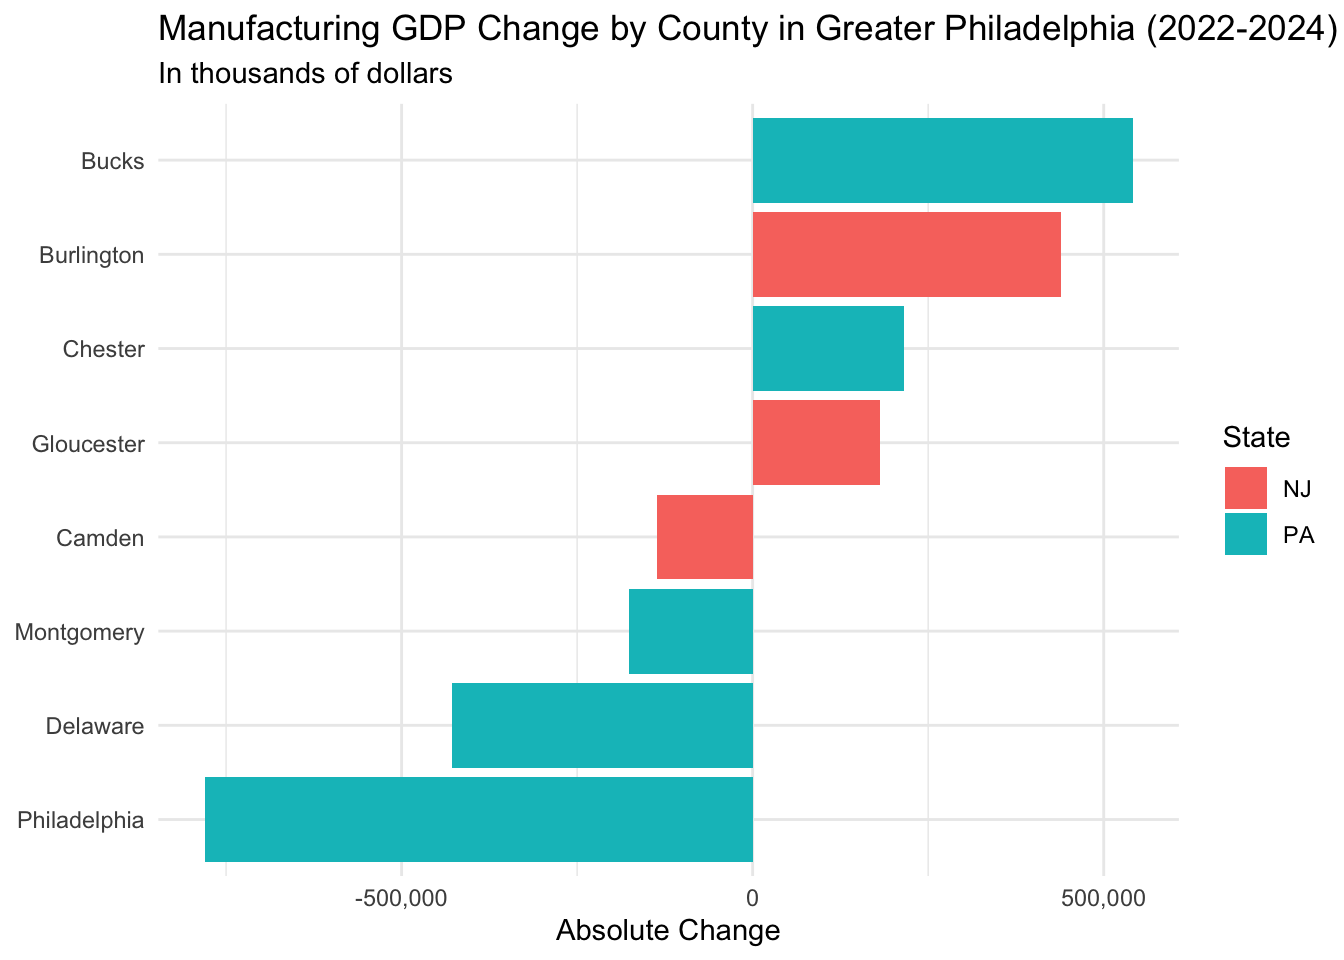
Delaware County is the only county in the greater Philadelphia region whose GDP shrank between 2022 and 2024. Manufacturing industry in Delaware County lost more than $428 million in output, showing a 12% decline. Meanwhile, neighboring counties like Bucks and Burlington saw their manufacturing GDP grow by double digits over the same period.

Show code
#Retrieve GDP Data
gdp_county <- read_csv("https://raw.githubusercontent.com/djnf-data-2026/master/refs/heads/main/data/bea_gdp_2024_county_CAGDP1.csv", skip=3) |> 
  clean_names() |> 
    mutate(across(3:5, as.numeric))

#Calculate change 2024 vs 2022; split out state
gdp_county <- gdp_county |> 
  mutate(pct_24_v_22 = (x2024-x2022)/x2022,
          state = str_split_fixed(geo_name, ", ", 2)[, 2],
         county = str_split_fixed(geo_name, ", ", 2)[, 1])  

philly_gdp <- gdp_county |>
  filter(state == "PA" | state == "NJ") |>
  filter(county %in% c("Philadelphia", "Montgomery", 
                        "Bucks", "Chester", 
                        "Delaware", "Gloucester", 
                        "Camden", "Burlington")) |>
  select(county, state, x2022, x2024, pct_24_v_22) |>
  mutate(rank(x2022)) |>
  mutate(rank(x2024)) |>
  arrange(desc(pct_24_v_22))

#Chart: GDP Growth by County
  #AI assisted

ggplot(philly_gdp, aes(x = reorder(county, pct_24_v_22), y = pct_24_v_22, fill = state)) +
  geom_col() +
  coord_flip() +
  scale_y_continuous(labels = scales::percent) +
  labs(
    title = "GDP Growth by County in Greater Philadelphia (2022-2024)",
    x = NULL,
    y = "Percent Change",
    fill = "State"
  ) +
  theme_minimal()

If you are not familiar with the greater Philadelphia region (neither was I before this project!), the following map shows the eight counties covered in this analysis.

Greater Philadelphia refers to Philadelphia and its surrounding counties in Pennsylvania (Montgomery, Bucks, Chester, and Delaware) and across the Delaware River in New Jersey (Camden, Burlington, and Gloucester).

GDP CAGDP1 County gross domestic product (GDP) summary Real Gross Domestic Product (GDP) (Thousands of chained 2017 dollars) Source Page

And more detail: GDP by County

According to Delaware County’s official history, the county has a long history as an industrial hub, home to shipbuilders, locomotive makers, and oil refineries. But the county’s manufacturing sector has been shrinking for decades, and the latest BEA data shows it is still losing ground.

The Federal Reserve Bank of Philadelphia’s May 2026 Manufacturing Business Outlook Survey found that the employment index remained negative for the third time in four months, suggesting the region’s manufacturing job losses are ongoing.

WHYY reported in 2023 that the greater Philadelphia region experienced nine consecutive months of manufacturing slowdown, with factory closures and layoffs in Philadelphia and King of Prussia.

No reporting has specifically asked why Delaware County has failed to compensate for those losses with growth in other sectors, or what that means for the workers and communities left behind.

Potential impact

A sustained decline in Delaware County’s manufacturing output likely means fewer stable jobs for working-class residents, reduced tax revenue for local services, and a widening gap between the county and its neighbors.

Target audience

Residents and workers in Delaware County and the greater Philadelphia region

Data Findings

Industry decline trend cross the greater Philly

BEA CAGDP2 — GDP by Industry (Current dollars)* CAGDP2 GDP by industry in current dollars

I want to see Top 10 Industries with Largest Decline Across the greater Philly. Delaware County’s manufacturing sector ranks third on the list, which likely explains why it is the only county in the region with negative GDP growth.

Show code
# Load and Clean Data
# Merge Pennsylvania and New Jersey industry files
gdp_industry <- bind_rows(
  read_csv("../data/CAGDP2_GPD_PA_Industry.csv", skip = 3) |> clean_names(),
  read_csv("../data/CAGDP2_GPD_NJ_Industry.csv", skip = 3) |> clean_names()
)

# Using Private industries sub-categories only (excluding aggregates to avoid double counting)
gdp_industry <- gdp_industry |>
 mutate(
  x2022 = as.numeric(x2022),
  x2023 = as.numeric(x2023),
  x2024 = as.numeric(x2024)
)

  # AI-assisted
greater_philly_total <- gdp_industry |>
  filter(str_detect(geo_name, "Philadelphia, PA|Montgomery, PA|Bucks, PA|Chester, PA|Delaware, PA|Gloucester, NJ|Camden, NJ|Burlington, NJ")) |>
  filter(line_code == 1) |> 
  select(geo_name, description, x2022, x2023, x2024) |>
  mutate(pct_24_v_22 = round((x2024 - x2022) / x2022, 4)) |>
  arrange(desc(pct_24_v_22))

greater_philly_industry <- gdp_industry |>
  filter(str_detect(geo_name, "Philadelphia, PA|Montgomery, PA|Bucks, PA|Chester, PA|Delaware, PA|Gloucester, NJ|Camden, NJ|Burlington, NJ"))  |>
  filter(description %in% c(
    "Agriculture, forestry, fishing and hunting",
    "Mining, quarrying, and oil and gas extraction",
    "Utilities",
    "Construction",
    "Manufacturing",
    "Wholesale trade",
    "Retail trade",
    "Transportation and warehousing",
    "Information",
    "Finance, insurance, real estate, rental, and leasing",
    "Professional and business services",
    "Educational services, health care, and social assistance",
    "Arts, entertainment, recreation, accommodation, and food services",
    "Other services (except government and government enterprises)"
  )) |>
  select(geo_name, description, x2022, x2024) |>
  mutate(pct_24_v_22 = round((x2024 - x2022) / x2022, 4)) |>
  mutate(x24_v_22 = x2024 - x2022) |>
  arrange(desc(x24_v_22))

greater_philly_industry |>
  slice_min(x24_v_22, n = 10) |>
  select(geo_name, description, x24_v_22)
# A tibble: 10 × 3
   geo_name         description                                x24_v_22
   <chr>            <chr>                                         <dbl>
 1 Philadelphia, PA Information                                -2021288
 2 Philadelphia, PA Manufacturing                               -780623
 3 Delaware, PA     Manufacturing                               -428787
 4 Chester, PA      Information                                 -306887
 5 Montgomery, PA   Manufacturing                               -175826
 6 Camden, NJ       Manufacturing                               -136799
 7 Chester, PA      Agriculture, forestry, fishing and hunting  -107686
 8 Gloucester, NJ   Utilities                                    -95262
 9 Burlington, NJ   Agriculture, forestry, fishing and hunting   -68145
10 Bucks, PA        Agriculture, forestry, fishing and hunting   -53294

I decide to have a closer look at Delaware County’s industry breakdown.

Which Industry Is Pulling Delaware County’s Economy Down?

Manufacturing is the primary driver of Delaware County’s GDP decline, with output falling 12.3% and losing over $428 million between 2022 and 2024.

Show code
delaware_gdp_industry <- greater_philly_industry |>
  filter(geo_name == "Delaware, PA") |>
  filter(x2022 > 0)

delaware_gdp_industry |>
  select(geo_name, description,pct_24_v_22, x24_v_22) |>
  arrange(x24_v_22)
# A tibble: 14 × 4
   geo_name     description                                 pct_24_v_22 x24_v_22
   <chr>        <chr>                                             <dbl>    <dbl>
 1 Delaware, PA Manufacturing                                   -0.123   -428787
 2 Delaware, PA Transportation and warehousing                  -0.0184   -45002
 3 Delaware, PA Information                                     -0.0155   -29394
 4 Delaware, PA Mining, quarrying, and oil and gas extract…     -0.759    -15660
 5 Delaware, PA Agriculture, forestry, fishing and hunting       1.77       7690
 6 Delaware, PA Wholesale trade                                  0.0306    45824
 7 Delaware, PA Utilities                                        0.144     80743
 8 Delaware, PA Construction                                     0.0529    96130
 9 Delaware, PA Other services (except government and gove…      0.140    133672
10 Delaware, PA Retail trade                                     0.123    314699
11 Delaware, PA Arts, entertainment, recreation, accommoda…      0.264    315840
12 Delaware, PA Finance, insurance, real estate, rental, a…      0.054    533901
13 Delaware, PA Educational services, health care, and soc…      0.134    678699
14 Delaware, PA Professional and business services               0.124    727266

Manufacturing industry GDP trend in greater philly

Philadelphia had the largest manufacturing decline both in percentage terms and absolute value, but its overall GDP remained positive. Delaware County, by contrast, lost 12% of its manufacturing output and saw its overall GDP turn negative.

Maybe its economy is more vulnerable and lacks other industries to fill the gap left by manufacturing’s decline.

Show code
philly_manufacturing <- greater_philly_industry |>
  filter(description == "Manufacturing") |>
  filter(x2022 > 0) |> #AI-assisted
  mutate(abs_change = x2024 - x2022) |>
  separate(geo_name, into = c("county", "state"), sep = ", ") |>
  arrange(abs_change)

  #AI assisted
ggplot(philly_manufacturing, aes(x = reorder(county, pct_24_v_22), y = pct_24_v_22, fill = state)) +
  geom_col() +
  coord_flip() +
  scale_y_continuous(labels = scales::percent) +
  labs(
    title = "Manufacturing GDP %Change by County in Greater Philadelphia (2022-2024)",
    x = NULL,
    y = "Percent Change",
    fill = "State"
  ) +
  theme_minimal()

Show code
  #AI assisted
ggplot(philly_manufacturing, aes(x = reorder(county, abs_change), y =abs_change , fill = state)) +
  geom_col() +
  coord_flip() +
  scale_y_continuous(labels = scales::comma) +
  labs(
    title = "Manufacturing GDP Change by County in Greater Philadelphia (2022-2024)",
    subtitle = "In thousands of dollars",
    x = NULL,
    y = "Absolute Change",
    fill = "State"
  ) +
  theme_minimal()

Which Manufacturing Sector Took the Biggest Hit?

Between 2015 and 2025, transportation equipment manufacturing, historically the largest employer among all manufacturing sub-sectors, lost nearly 1,600 jobs, a 29% decline.

  • BLS - Quarterly Census of Employment and Wages (QCEW)
  • Source: https://data.bls.gov/cew/apps/table_maker/v4/table_maker.htm#type=7&year=2025&qtr=A&own=5&area=42045&supp=0
  • NAICS Code instruction: https://www.bls.gov/iag/tgs/iag_index_naics.htm
  • data dictionary: https://www.bls.gov/cew/additional-resources/open-data/csv-data-slices.htm
  • file download: http://www.bls.gov/cew/data/api/2025/a/area/42045.csv

Examples of Recent Closures in Delaware County

Alloy Surfaces Company in Aston, a defense contractor that manufactured infrared decoys for the U.S. Army and the British Royal Air Force, announced in July 2025 that it would lay off 52 workers and evaluate whether to close or sell its facility. The company, owned by UK-based Chemring Group, once employed 616 workers across three Delaware County sites in 2007 and held a $347 million U.S. Army contract. After rounds of layoffs in 2012 and 2021, Alloy Surfaces was fully closed by the end of 2025.

Residents income

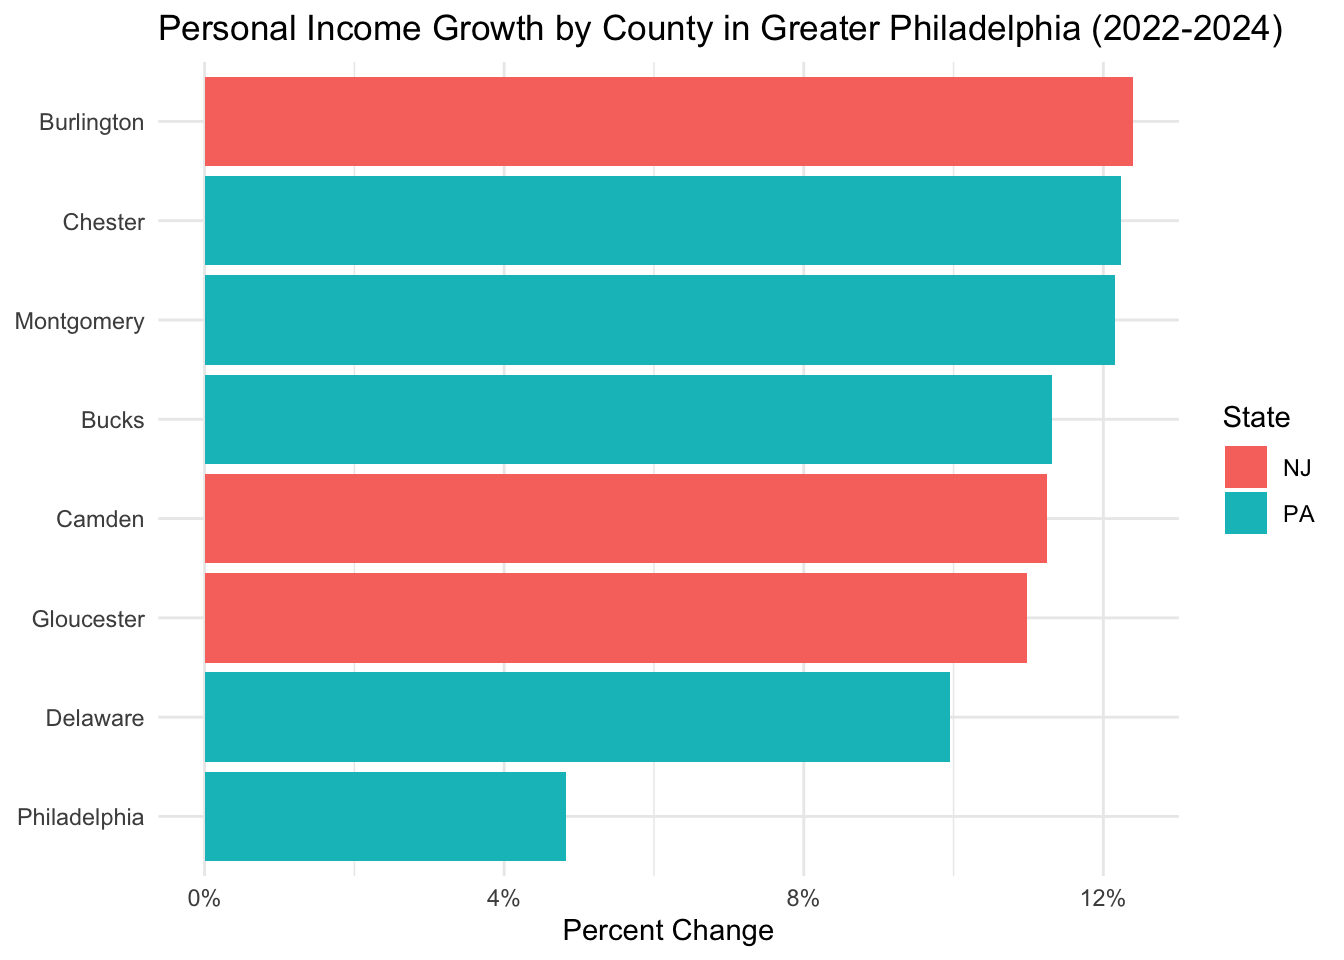
Personal income in Delaware County grew 10.98% between 2022 and 2024, yet its GDP was the only one in the region to shrink. Residents may be earning more by commuting to jobs elsewhere. Residents may be earning more by working elsewhere while local industries are losing ground.

BEA CAINC1 - County Personal Income Summary : personal income, population, per capita personal income Source: Personal income (Thousands of dollars)

Show code
#Load and Clean Data
cainc1 <- read_csv("../data/bea_gdp_2024_personal_income_county_CAINC1.csv", skip=3) |> 
  clean_names() |> 
  mutate(across(x2022:x2024, as.numeric)) |> 
  mutate(
    pct_23_v_22 = round((x2023 - x2022) / x2022, 4),
    pct_24_v_23 = round((x2024 - x2023) / x2023, 4),
    pct_24_v_22 = round((x2024 - x2022) / x2022, 4)
  )

#Filter Greater Philadelphia
philly_income <- cainc1 |>
  filter(str_detect(geo_name, "Philadelphia, PA|Montgomery, PA|Bucks, PA|Chester, PA|Delaware, PA|Gloucester, NJ|Camden, NJ|Burlington, NJ")) |>
  select(geo_name, x2022, x2024, pct_24_v_22) |>
  separate(geo_name, into = c("county", "state"), sep = ", ") |>
  arrange(desc(pct_24_v_22))

#Chart: Personal Income Growth by County
  #AI assisted

ggplot(philly_income, aes(x = reorder(county, pct_24_v_22), y = pct_24_v_22, fill = state)) +
  geom_col() +
  coord_flip() +
  scale_y_continuous(labels = scales::percent) +
  labs(
    title = "Personal Income Growth by County in Greater Philadelphia (2022-2024)",
    x = NULL,
    y = "Percent Change",
    fill = "State"
  ) +
  theme_minimal()

Future Work

Other information that I need to gather

  • Employment data for Delaware County to understand where workers went as manufacturing shrank, and why personal income continued to rise despite the GDP decline.
  • Population change data would help confirm whether residents are leaving the county.
  • Specific factory closure records from Pennsylvania WARN notices to identify which employers cut jobs during this period.
  • Union activity data, including strike records and contract outcomes, to understand whether workers retained bargaining power as manufacturing shrank.

Potential sources

  1. Ryotaro Tashiro, outreach economist at the Federal Reserve Bank of Philadelphia, who tracks economic trends across the greater Philladelphia area. He is responsible for the Chamber of Commerce for Greater Philadelphia Economic Outlook Survey. He could provide context on the broader manufacturing decline across southeastern Pennsylvania.
  2. Brian C. Eury, Chair of Delaware County Industrial Development Authority, who could speak to what industries the county has tried to attract and whether any economic diversification strategies are underway. (610) 566-2225
  3. Todd Farally, president of the Delaware County Central Labor Council, AFL-CIO, , who could speak to job losses across the county’s manufacturing sector

Estimated delivery

Data analysis will be complete by June 7. Interviews will wrap up by June 15. A first draft will be ready by June 17.